Figure 7. Functional food mix attenuated retinal cell apoptosis in streptozotocin induced diabetes. A: Representative immunoblots depicting expression of Bax, Bcl2, cleaved caspase 3, and caspase 12 in rat retina. B-F: Quantitative analysis of Bax, Bcl2, cleaved caspase 3, and caspase 12 normalized with β-actin. Data are presented as mean
± SD, n = 4 per group. Significant differences between control (C) and diabetes (D, D+FF1, D+FF2) groups are indicated by
*p ≤ 0.05. Significant differences between untreated diabetes (D) and treated diabetes (D+FF1, D+FF2) groups are indicated by
#p ≤ 0.05. C, control; D, diabetes (untreated); D+FF1, diabetes treated with FF1; D+FF2, diabetes treated with FF2 group.
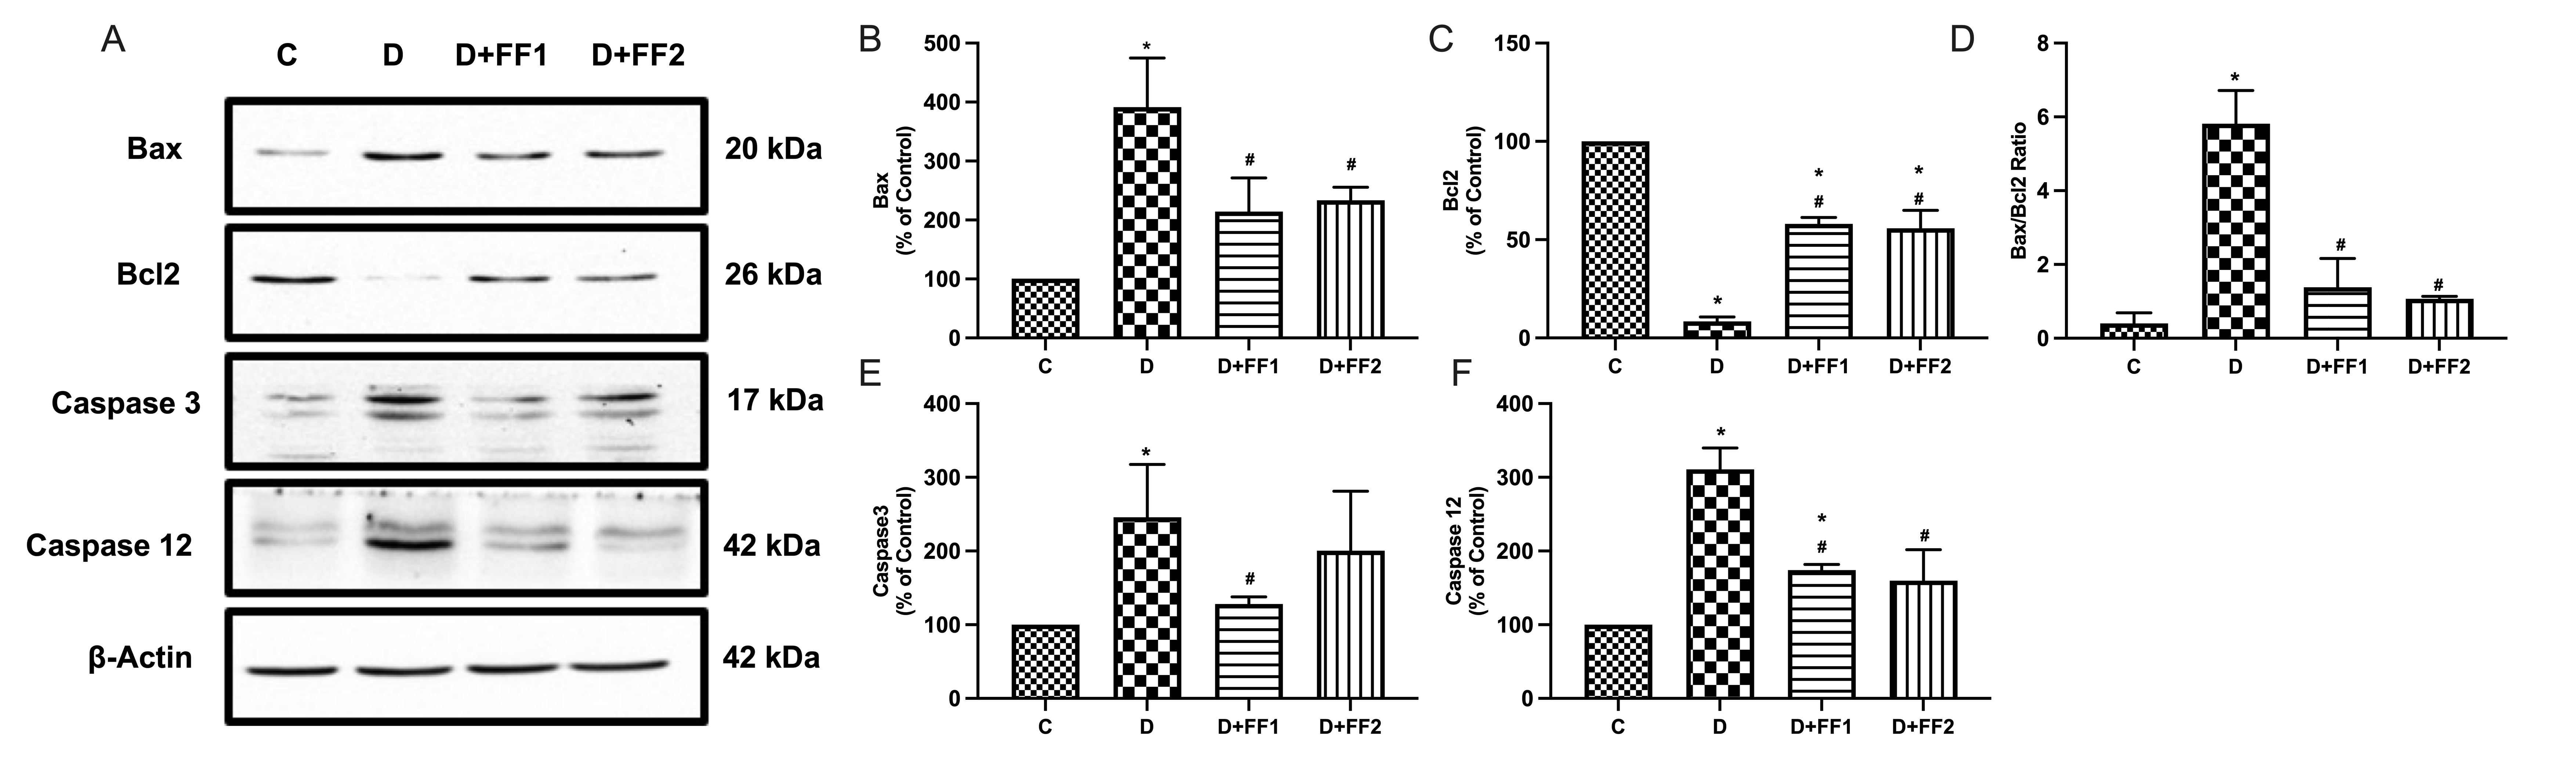
 Figure 7 of
Kalahasti, Mol Vis 2025; 31:411-422.
Figure 7 of
Kalahasti, Mol Vis 2025; 31:411-422.