Figure 5. Functional food mix prevented retinal angiogenesis and gliosis in streptozotocin induced diabetes. A: Representative immunoblots depicting expression of HIF-1α and VEGF in rat retina. B, C: Quantitative analysis of HIF-1α and VEGF normalized with β-actin. Data represented as mean ± SD, n = 4 per group. Significant
differences between control (C) and diabetes (D, D+FF1, D+FF2) groups are indicated by *p ≤ 0.05. Significant differences between untreated diabetes (D) and treated diabetes (D+FF1, D+FF2) groups are indicated by
#p ≤ 0.05. Immunofluorescence staining of glial fibrillary acidic protein (GFAP) in the retina. GFAP stain was increased in
the D group and reduced with FF supplementation. Blue: Nuclear stain with 4′,6-diamidino-2-phenylindole. Red: GFAP stain.
Merged: 4′,6-diamidino-2-phenylindole and GFAP. 40× magnification, scale bar = 10 µm, and n = 3 per group. C, control; D,
diabetes (untreated); D+FF1, diabetes treated with FF1; D+FF2, diabetes treated with FF2 group.
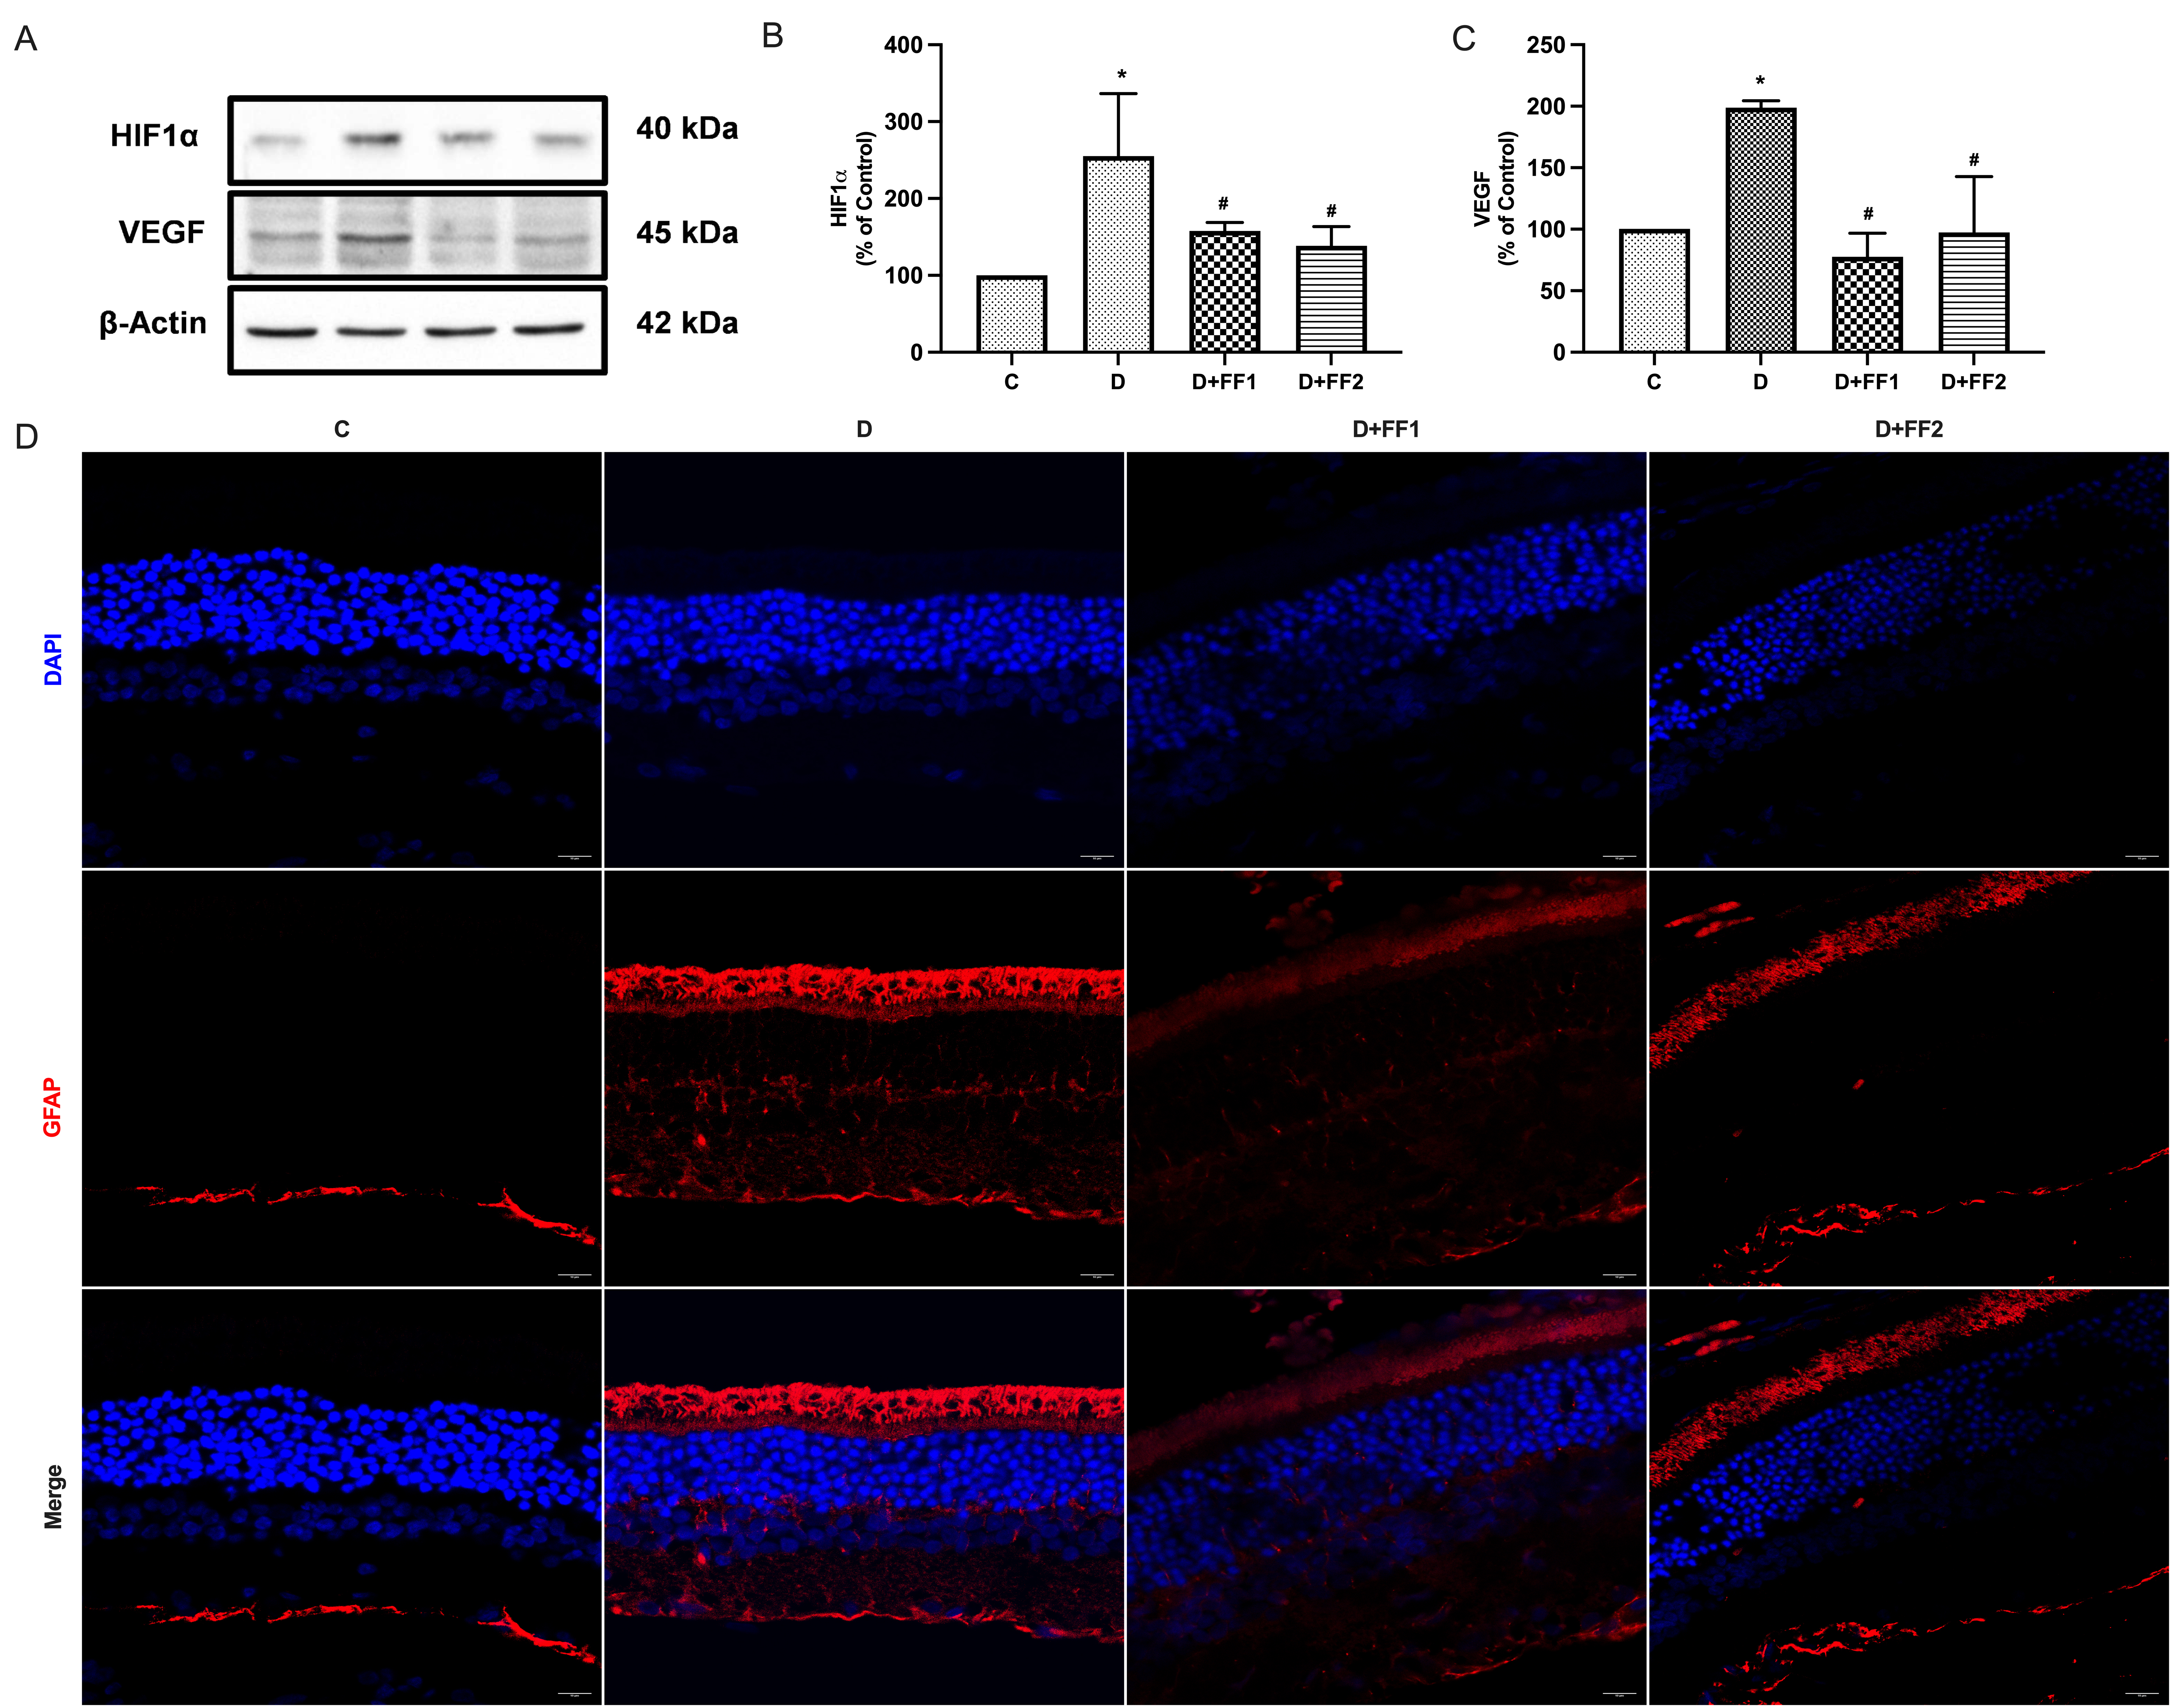
 Figure 5 of
Kalahasti, Mol Vis 2025; 31:411-422.
Figure 5 of
Kalahasti, Mol Vis 2025; 31:411-422.