Figure 2. Functional food mix improved scotopic retinal function in streptozotocin induced diabetic rats as assessed by electroretinogram.
A: Scotopic a-wave amplitudes of electroretinogram of rats. B: Mean amplitude of all the a-wave flash intensities together. C: Scotopic a-wave amplitude at 8-dB flash intensity. D: Scotopic b-wave. E. Mean amplitude of all the b-wave flash intensities together. F: Scotopic b-wave amplitude at a 4-dB flash intensity. Data are presented as mean ± SEM, n = 7 per group. Significant differences
between control (C) and diabetes (D, D+FF1, D+FF2) groups are indicated by *p ≤ 0.05. Significant differences between untreated diabetes (D) and treated diabetes (D+FF1, D+FF2) groups are indicated by
#p ≤ 0.05. C, control; D, diabetes (untreated); D+FF1, diabetes treated with FF1; D+FF2, diabetes treated with FF2 group.
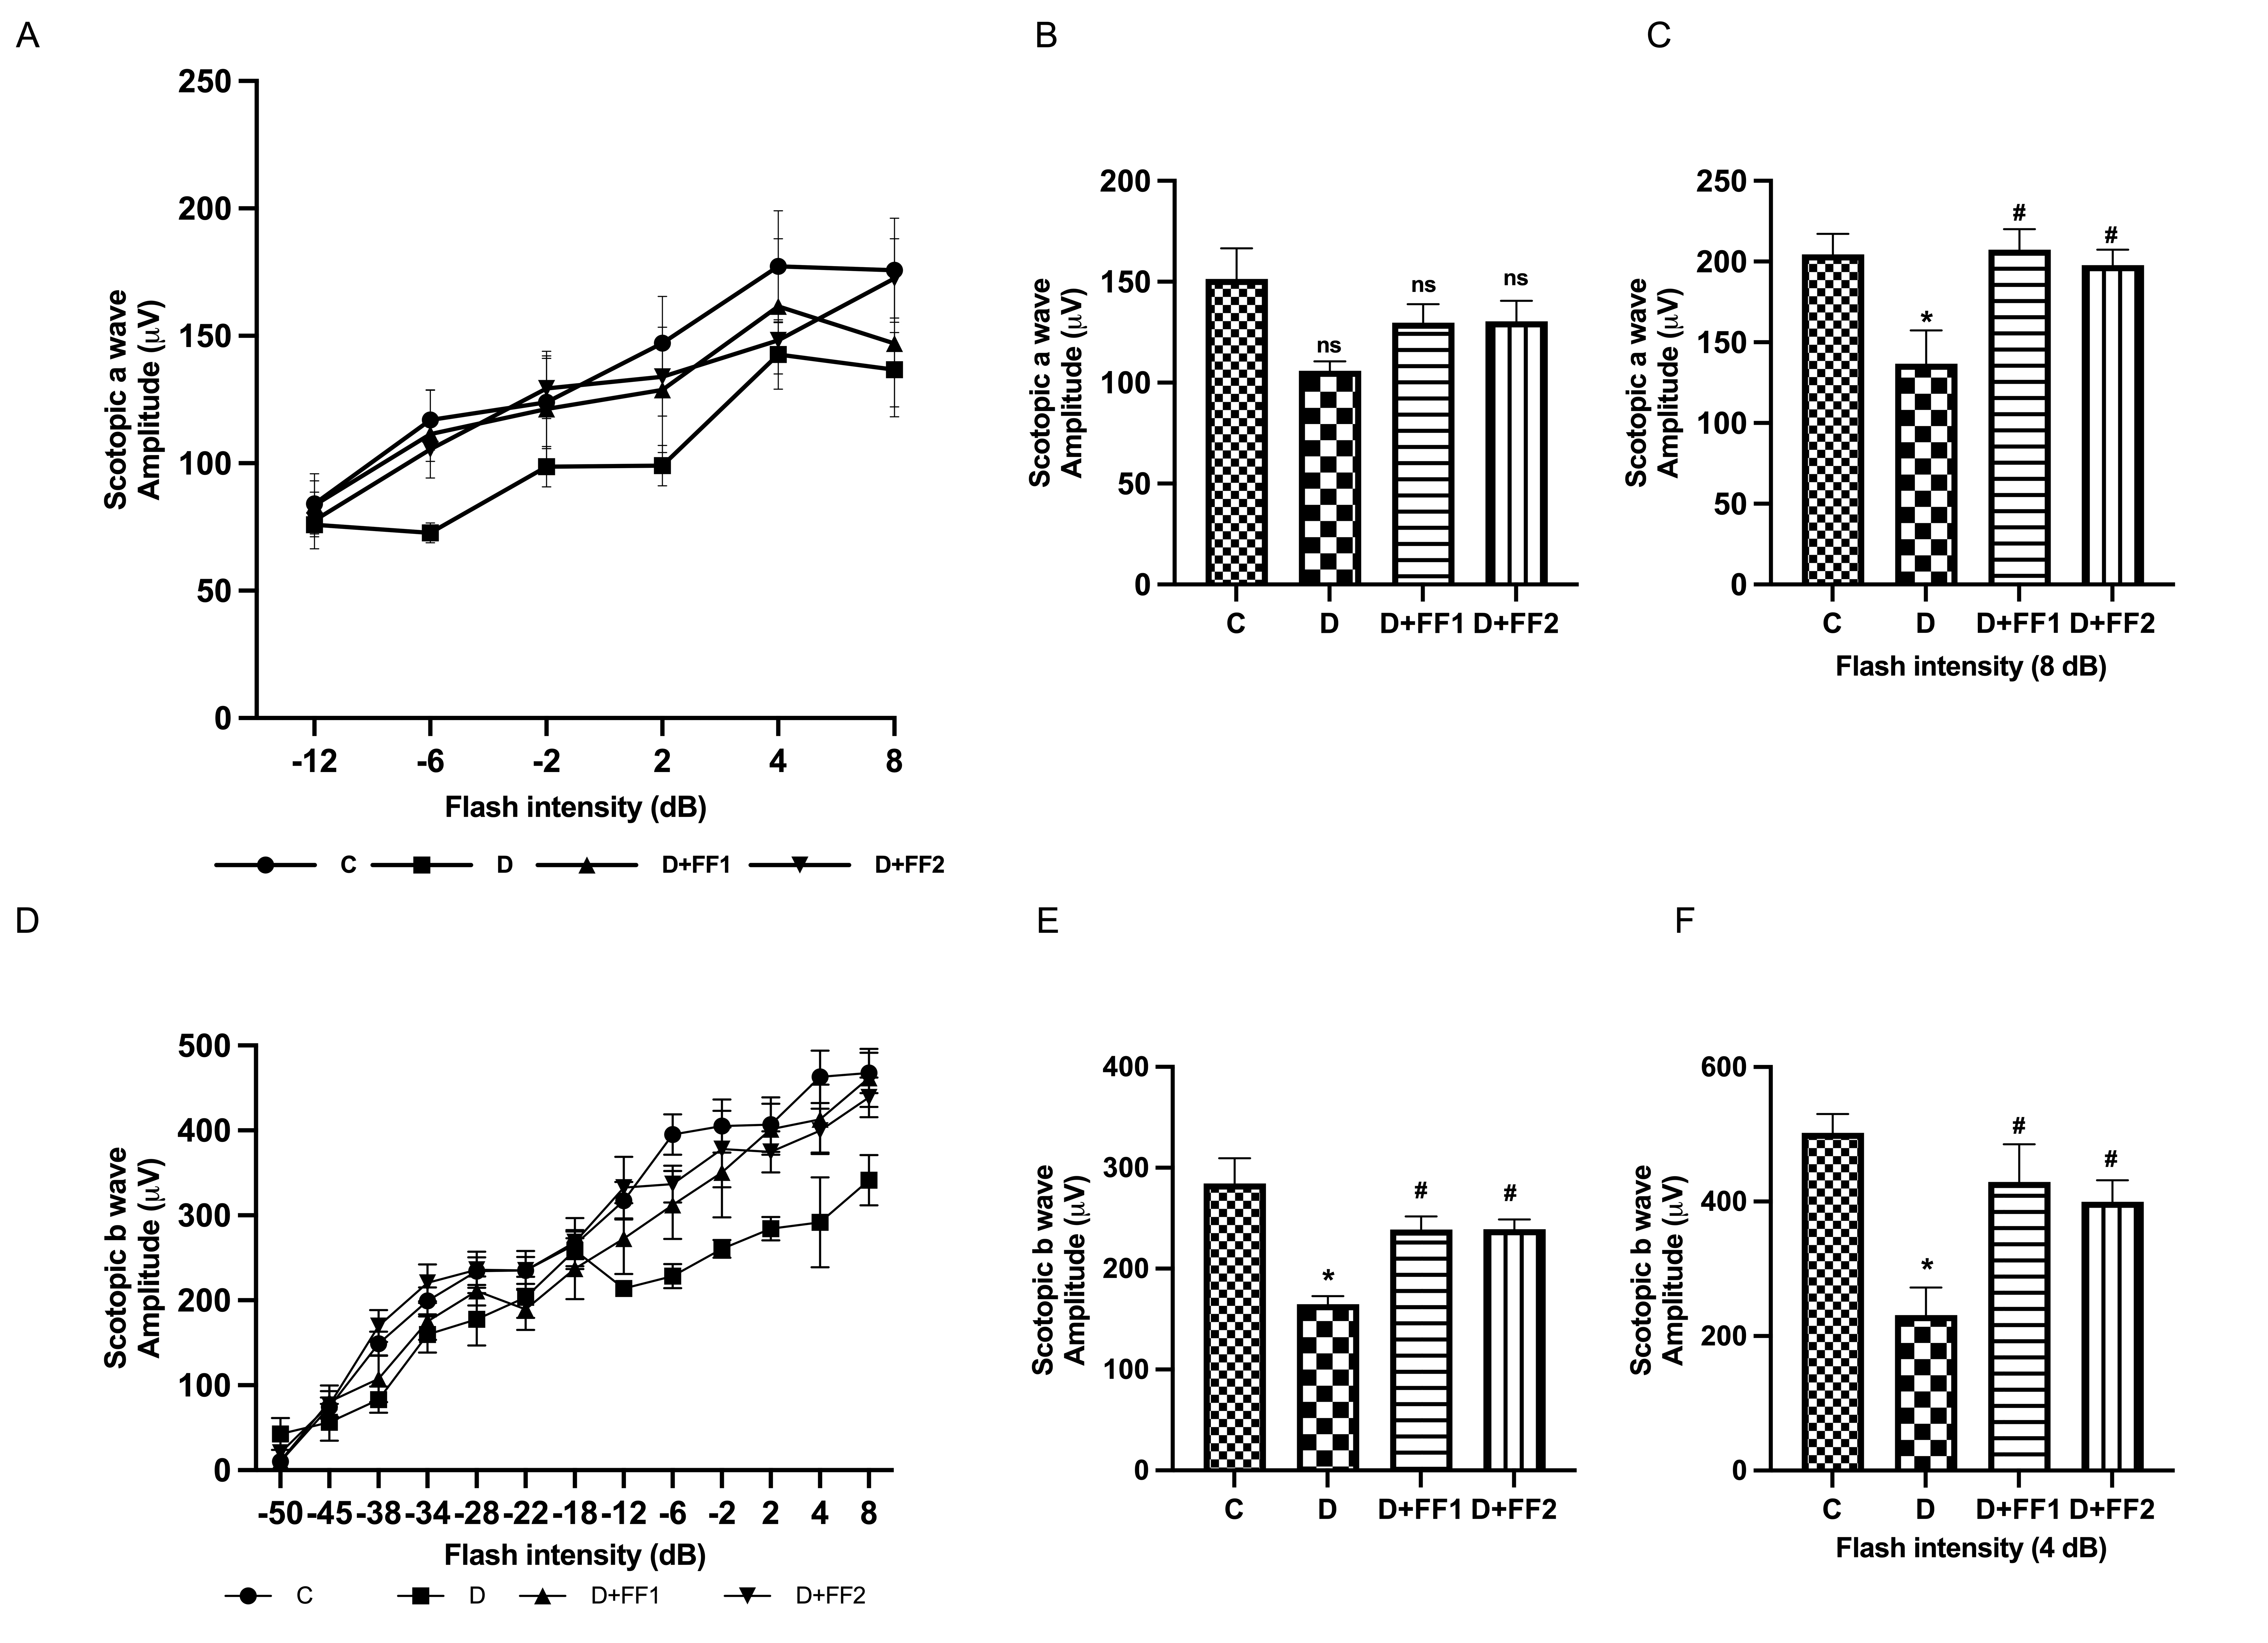
 Figure 2 of
Kalahasti, Mol Vis 2025; 31:411-422.
Figure 2 of
Kalahasti, Mol Vis 2025; 31:411-422.