Figure 1. Functional food mix ameliorated fasting blood glucose levels of streptozotocin induced diabetic rats. Data are presented as
mean ± SEM, n = 7 per group. Significant differences between control (C) and diabetes (D, D+FF1, D+FF2) groups are indicated
by *p ≤ 0.05. Significant differences between untreated diabetes (D) and treated diabetes (D+FF1, D+FF2) groups are indicated by
#p ≤ 0.05. C, control; D, diabetes (untreated); D+FF1, diabetes treated with FF1; D+FF2, diabetes treated with FF2 group.
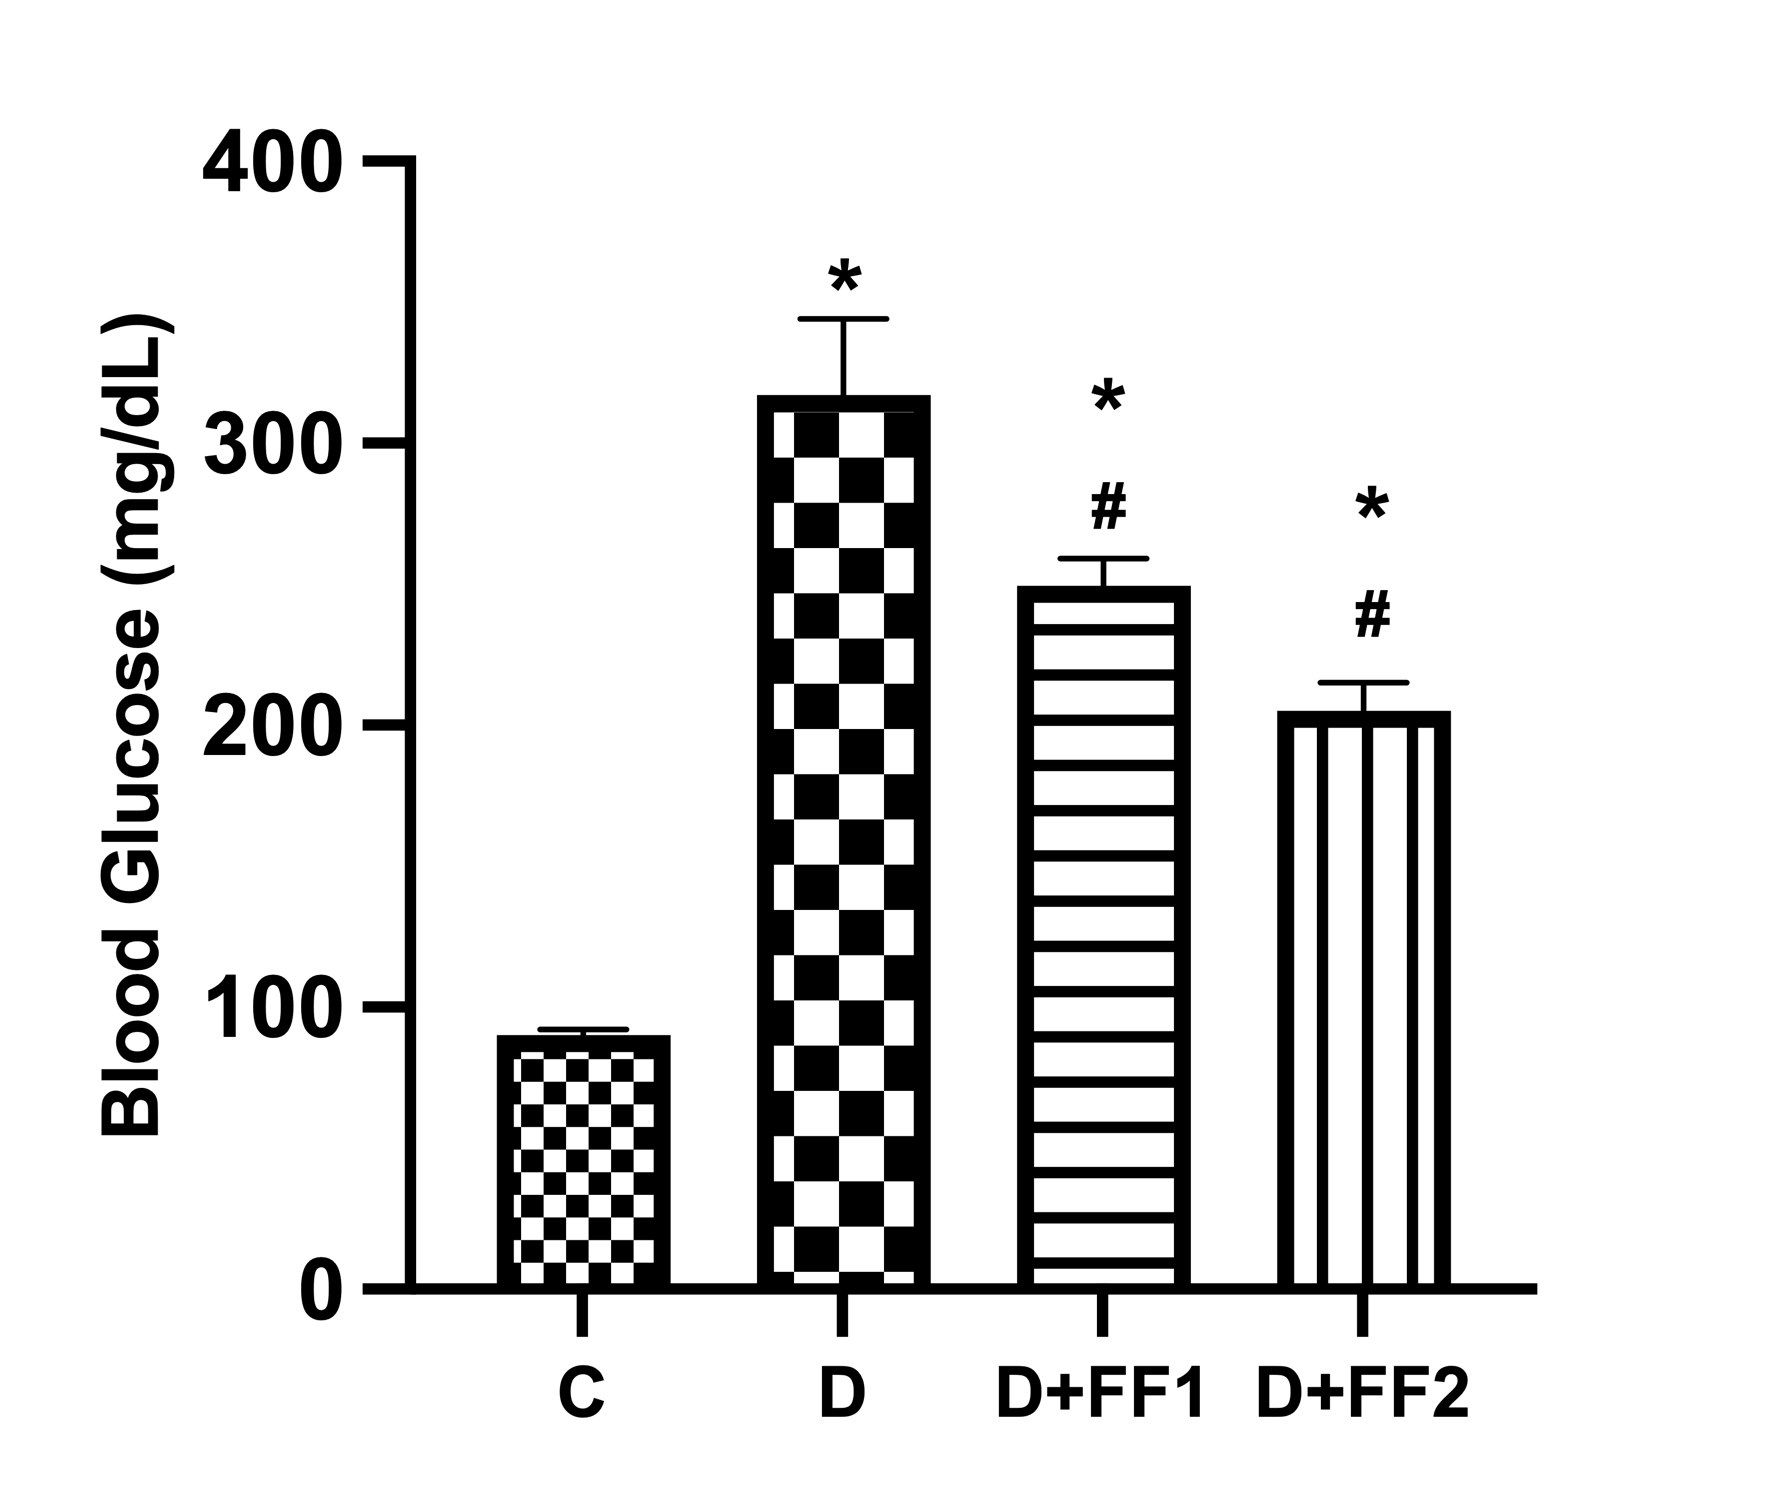
 Figure 1 of
Kalahasti, Mol Vis 2025; 31:411-422.
Figure 1 of
Kalahasti, Mol Vis 2025; 31:411-422.