Figure 5. The concentrations of the pro-inflammatory cytokines IL-1β and TNF-α were quantified in the ocular tissue of all experimental
groups. Data are presented as the mean ± SD (n = 6). Statistical significance is indicated as follows: double asterisks (p
< 0.01) and triple asterisks (*p < 0.001) denote a significant difference compared to the control (C) group; the symbols #,
+, and ^ denote significant differences compared to the untreated diabetic (D) group at #p < 0.05, ##p < 0.01, +p < 0.05,
++p < 0.01, ^p < 0.05, ^^p < 0.01, and ^^^p < 0.001.
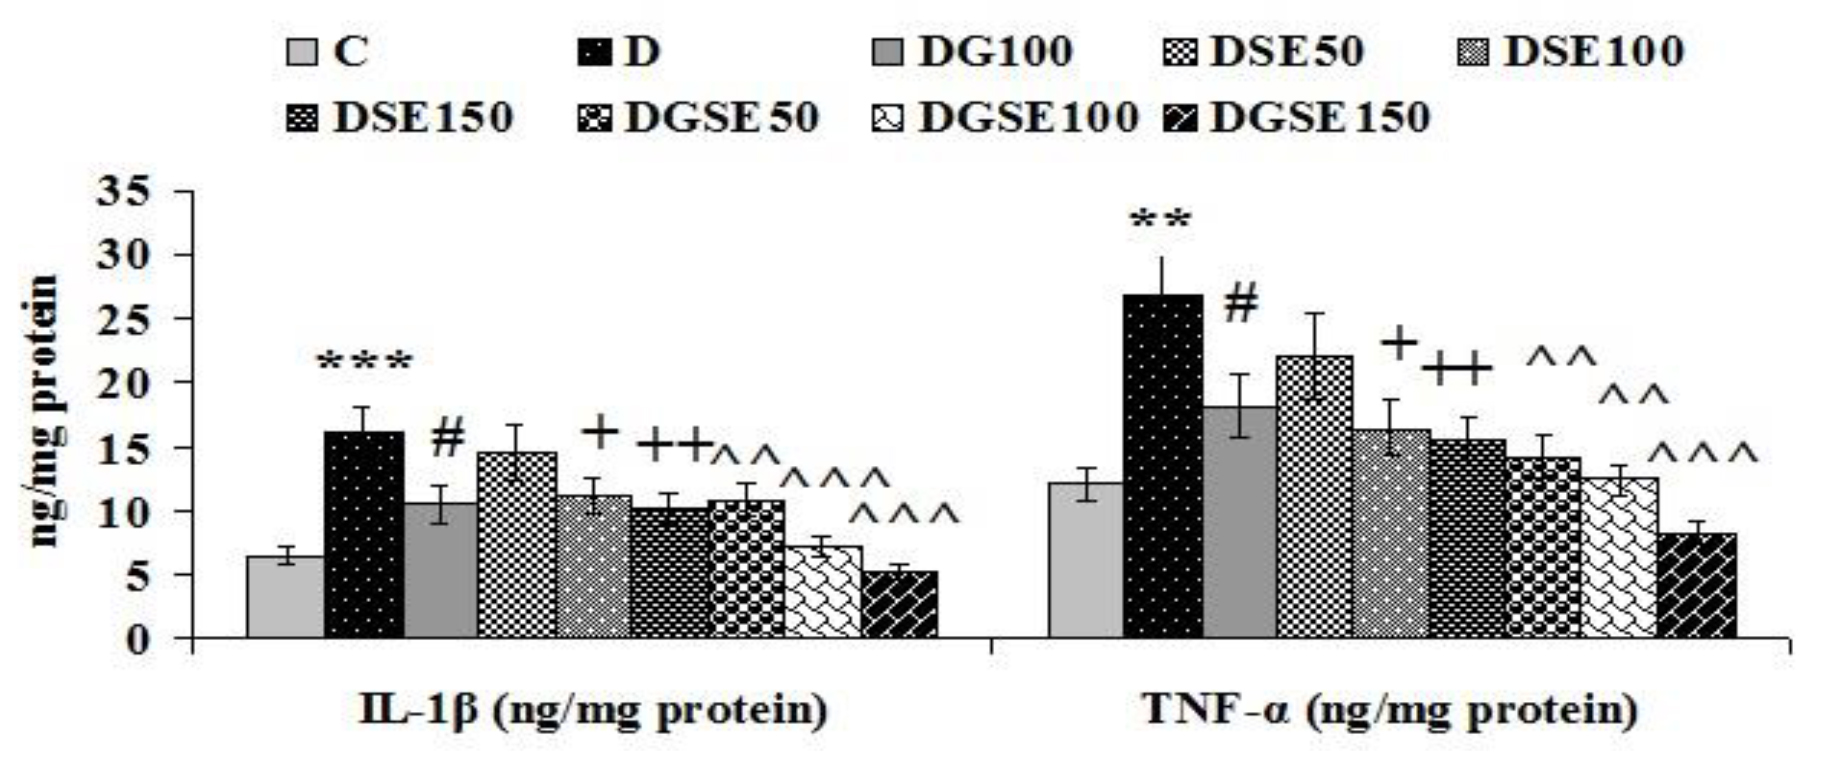
 Figure 5 of
Huang, Mol Vis 2025; 31:396-409.
Figure 5 of
Huang, Mol Vis 2025; 31:396-409.