Figure 4. The activities of antioxidant enzymes (SOD, CAT, GPx) and the level of lipid peroxidation (MDA) were measured in the ocular
tissue of control and treated groups. All data are expressed as the mean ± SD (n = 6).**Asterisks denote statistically significant
differences compared to the control (C) group: ∗∗p < 0.01 and *p < 0.001.Symbols indicate statistically significant differences
compared to the untreated diabetic (D) group: #p < 0.05, ##p < 0.01, +p < 0.05, ++p < 0.01, ^p < 0.05, ^^p < 0.01, and ^^^p
< 0.001.
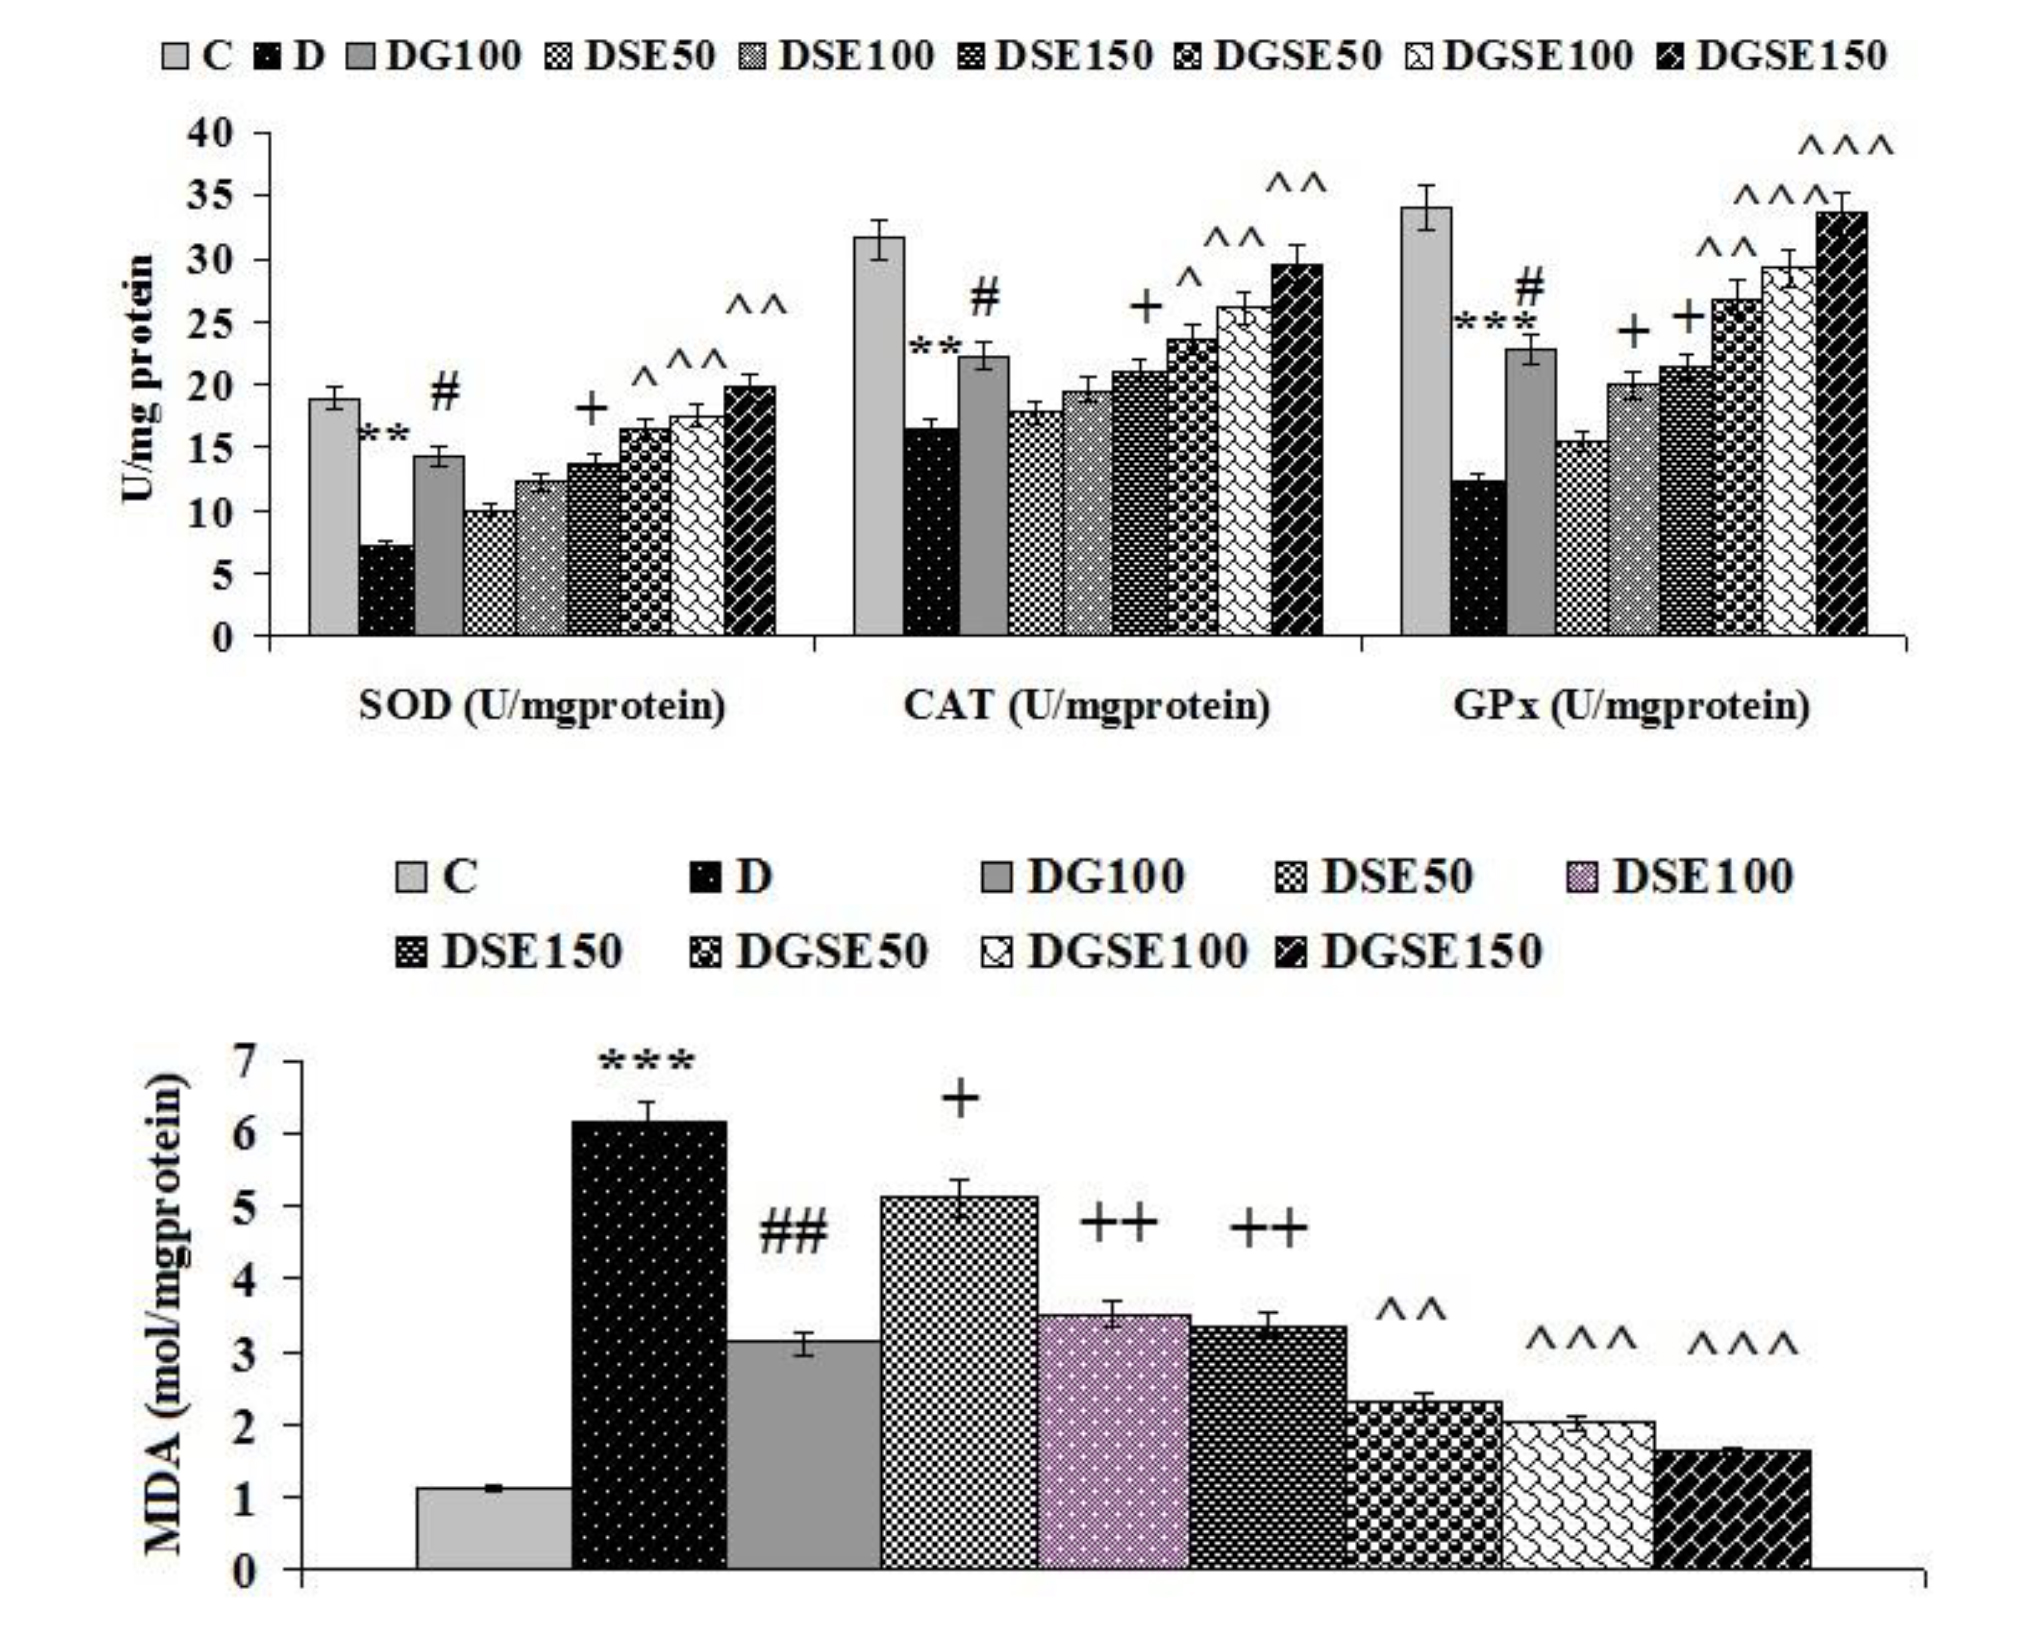
 Figure 4 of
Huang, Mol Vis 2025; 31:396-409.
Figure 4 of
Huang, Mol Vis 2025; 31:396-409.