Figure 3. Serum levels of insulin and glucose were measured in all experimental groups at the conclusion of the study. Values are presented
as mean ± SD (n = 6 per group). **Statistical analyses were performed using one-way ANOVA followed by Tukey's post hoc test.
Significant differences among multiple groups are indicated by different lowercase letters (p < 0.05). Additionally, asterisks
denote comparisons with the control (C) group: ∗∗p < 0.01 and *p < 0.001. Symbols indicate comparisons with the diabetic (D)
group: #p < 0.05, +p < 0.05, ^^p < 0.01, and ^p < 0.05.
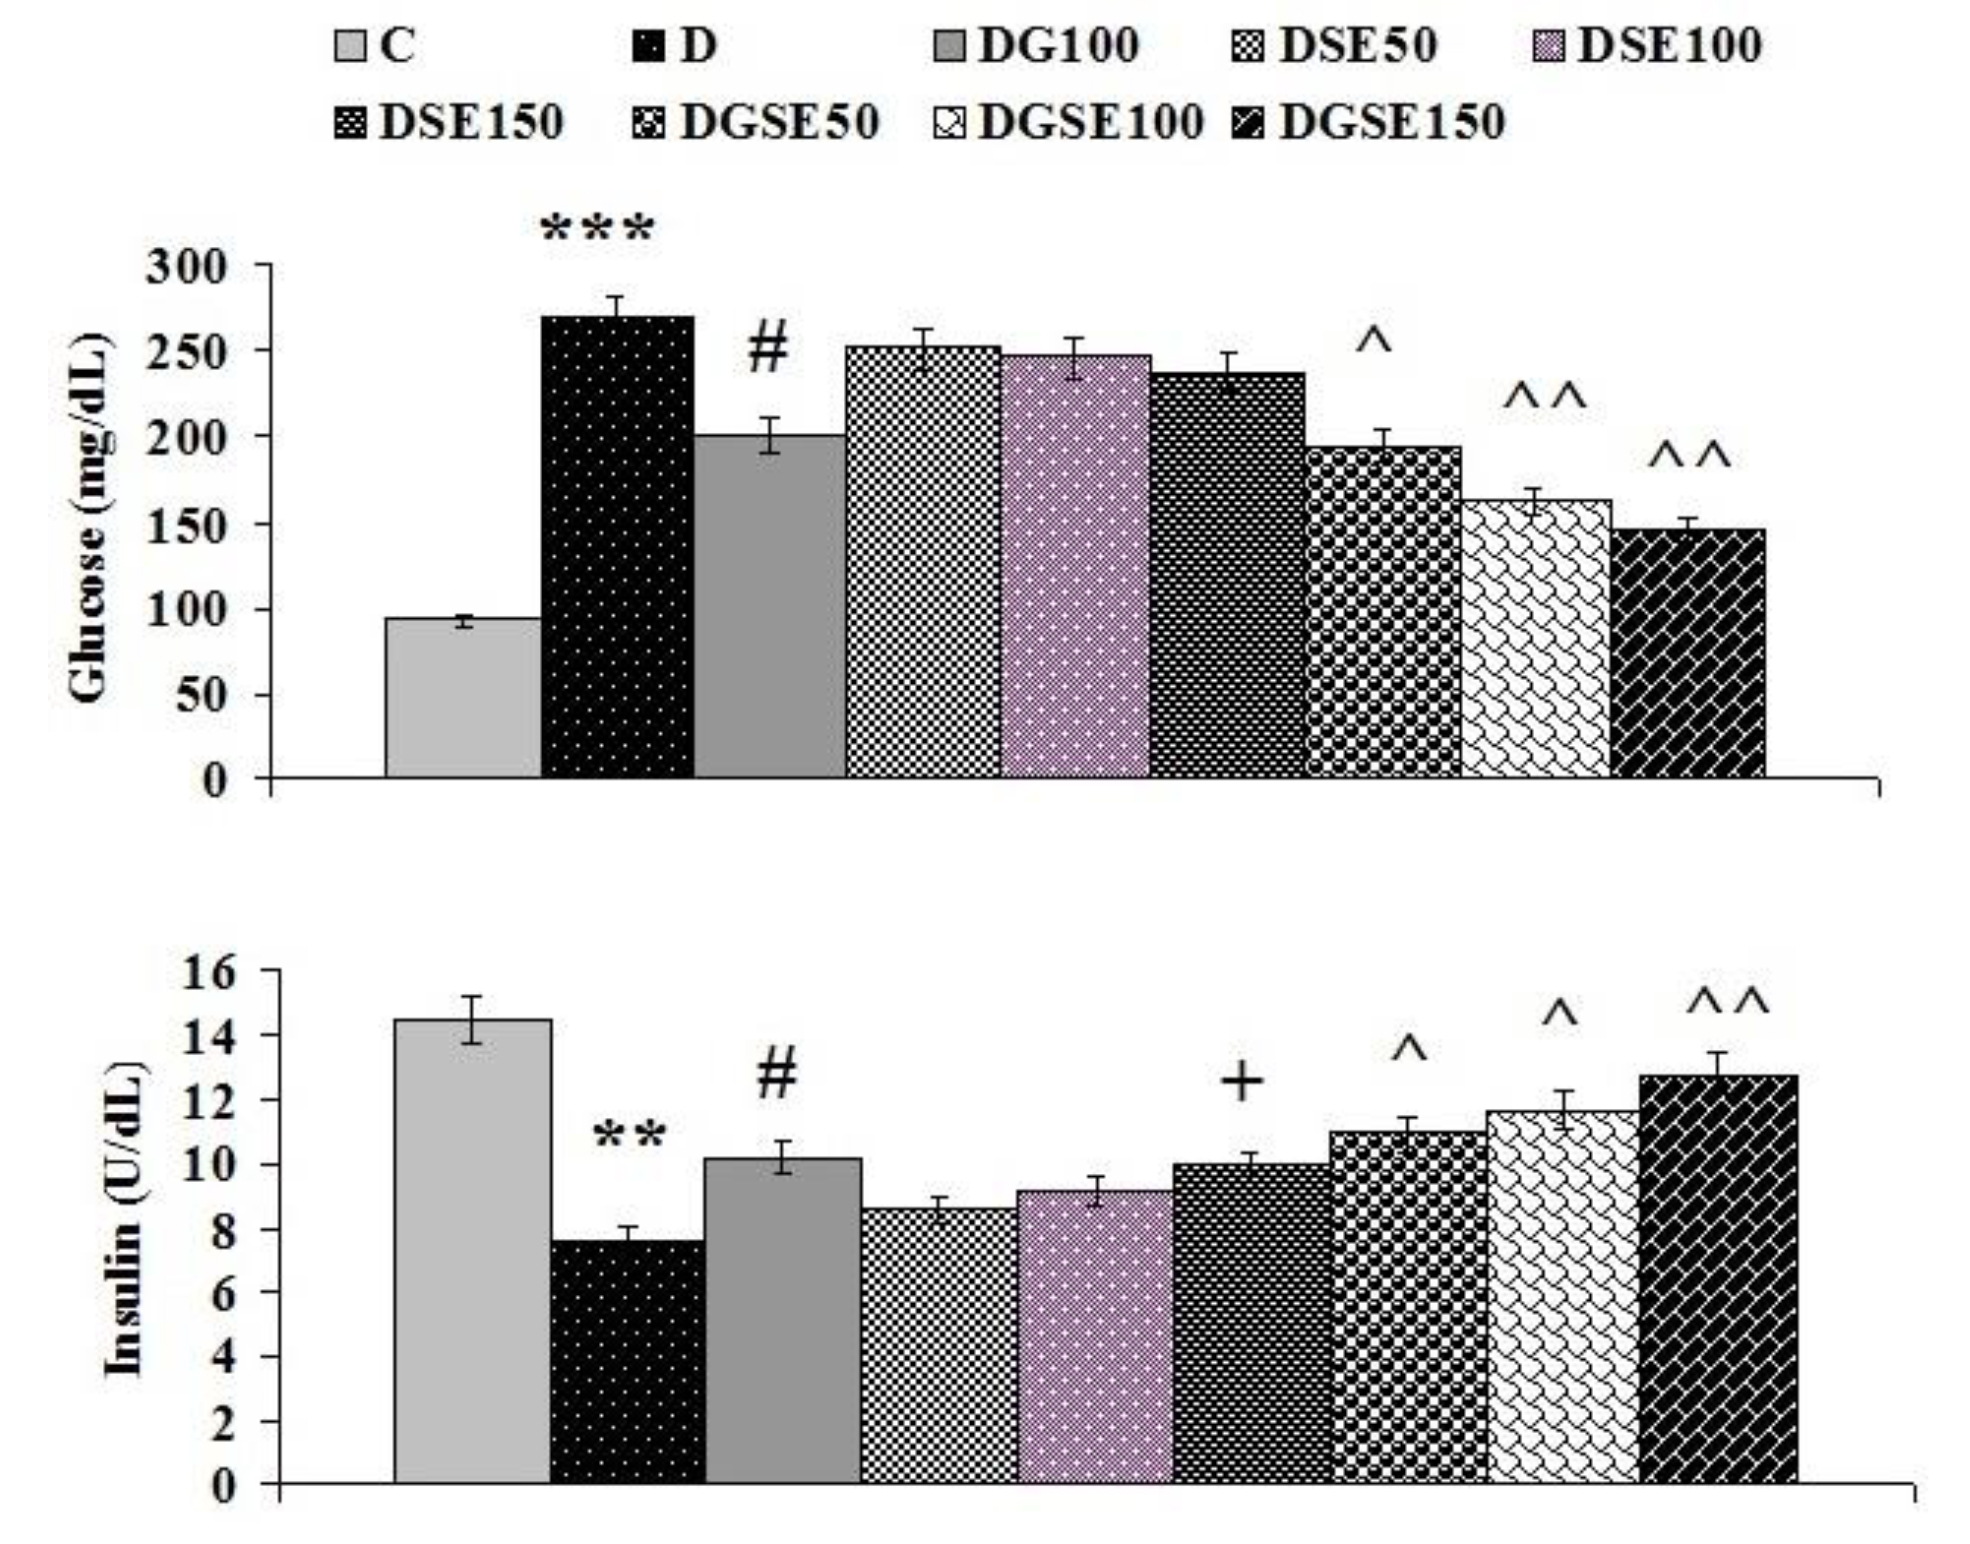
 Figure 3 of
Huang, Mol Vis 2025; 31:396-409.
Figure 3 of
Huang, Mol Vis 2025; 31:396-409.