Figure 2. Body weight changes were monitored throughout the study period in all experimental groups. Data are presented as mean ± SD
(n = 6). Week zero represents the baseline measurement prior to the induction of diabetes. Statistical significance is denoted
as follows: ∗∗p < 0.01 indicates a comparison with the control (C) group; #p < 0.05 and +p < 0.05 indicate a comparison with
the diabetic (D) group; ++p < 0.01 and ^^p < 0.01 indicate a comparison with the diabetic (D) group; ^p < 0.05 indicates a
comparison with the diabetic (D) group.
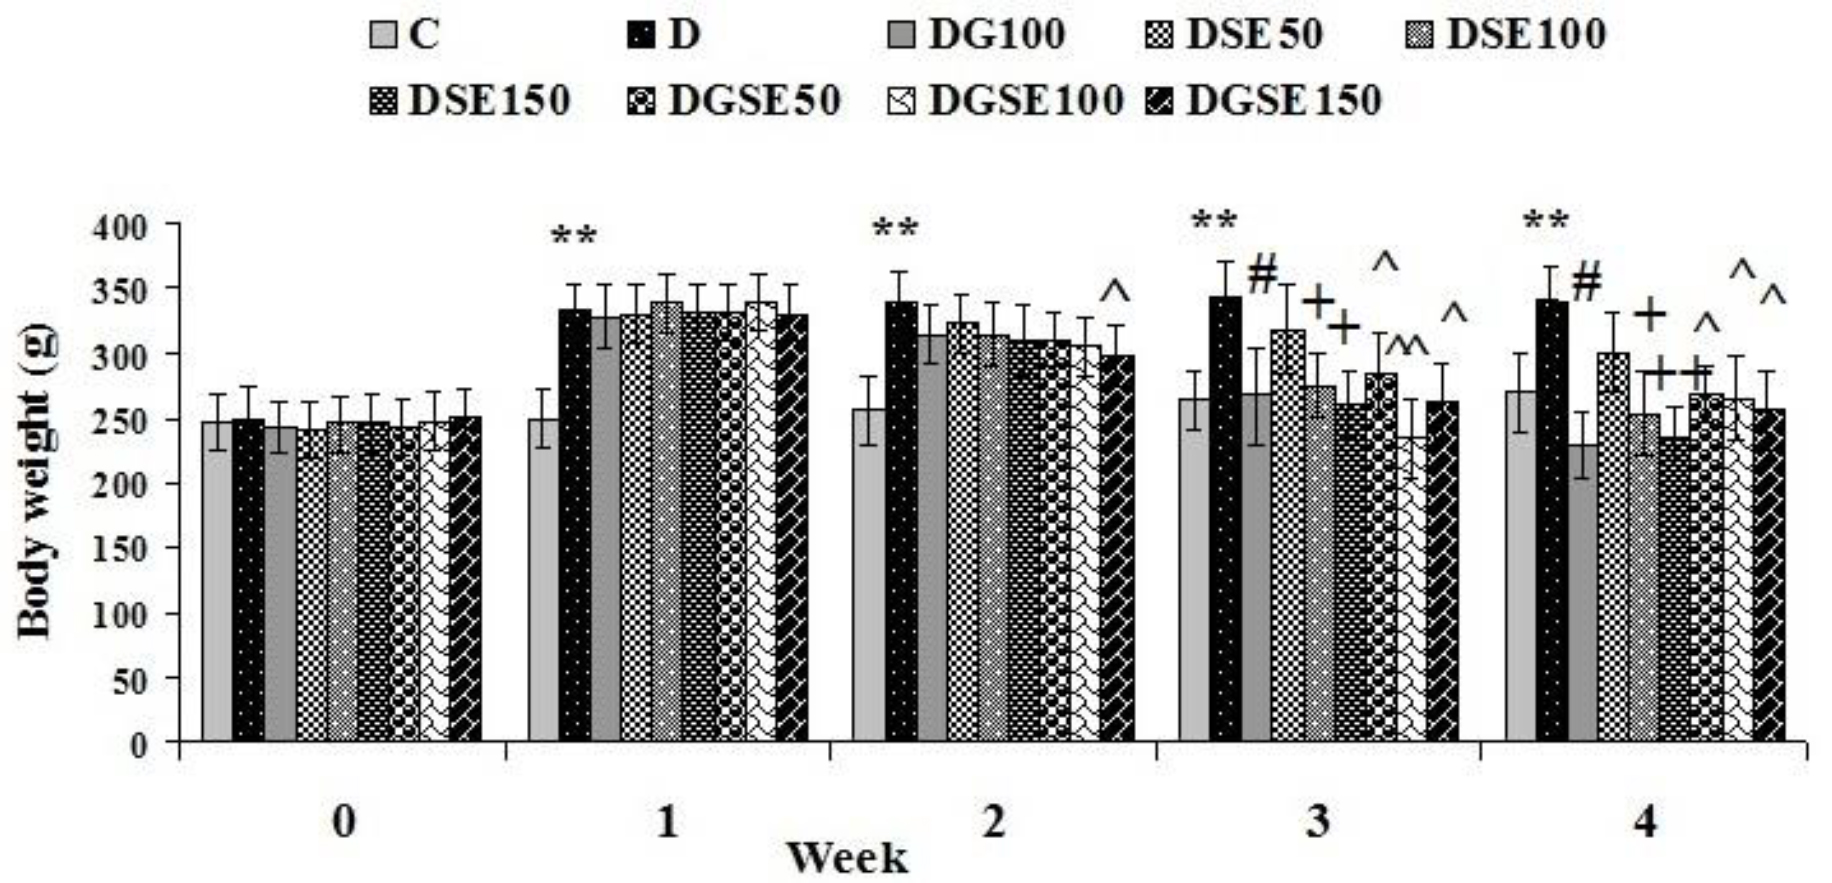
 Figure 2 of
Huang, Mol Vis 2025; 31:396-409.
Figure 2 of
Huang, Mol Vis 2025; 31:396-409.