Figure 6. Protein kinase and transcription factor inhibitors affect Na100-induced MCP-1 mRNA levels. ARPE-19 cells were pretreated for
1 h with 0.01% DMSO or inhibitor diluted in DMSO (to reach a final treatment concentration of 0.01% DMSO) and then incubated
for 8 h with Iso or Na100 in the presence of 0.01% DMSO or inhibitor diluted in DMSO (to reach a final treatment concentration
of 0.01% DMSO) prior to quantification of MCP-1 mRNA levels by RT-qPCR (A, B) or secreted MCP-1 protein levels by ELISA (C), as described under Methods. The inhibitors were used at the following concentrations: 1 μM SB203580, 2.5 μM GF109203X,
1 μM GO6976, 1 μM GO6983, 10 μM OSU-03012, 0.1 μM rapamycin, 1 μM decernotinib, 1 μM SCH772984, 10 μM MK-2206, 0.1 μM wortmannin,
50 μM LY294002, 10 μM EMD638683, 10 μM GSK650394, 50 μM SP600125, 2 μM roscovitine, 5 μM UO126, 20 μM PD98059, 0.25 μM 666-15,
5 μM CAPE, 0.25 μM mithramycin, 5 μM SR11302, 0.5 μM echinomycin, or 10 μM pifithrin. Data are expressed as the mean ± SEM
of the percentage of Na100-induced MCP-1 mRNA levels (A, B) or secreted MCP-1 protein levels (C) in the presence of DMSO,
set as 100%; n = 3 for rapamycin, decernotinib, pifithrin, SCH772984, and SB253580 and n = 4 for all other inhibitors and
DMSO (A, B, C). Data were analyzed using the conformity t test. *p < 0.05, **p < 0.01, ***p < 0.001.
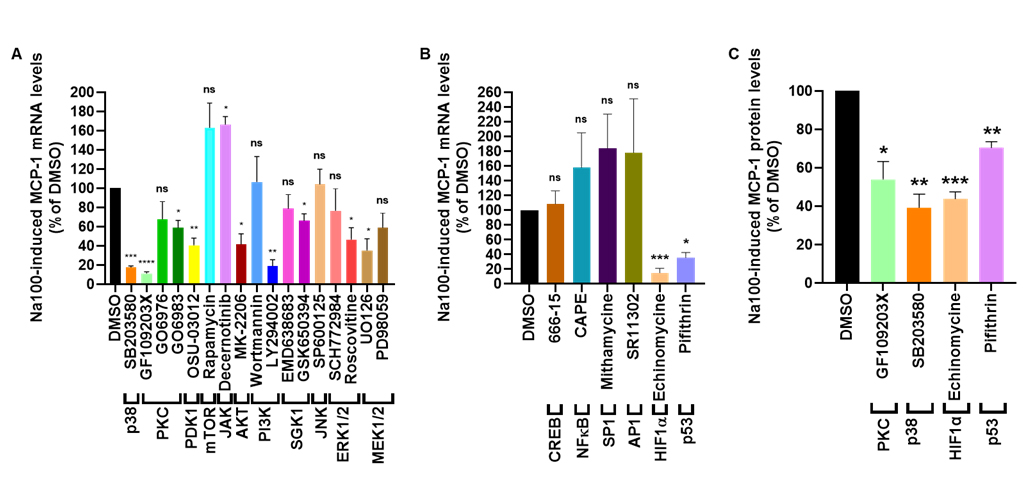
 Figure 6 of
Hamou, Mol Vis 2025; 31:380-394.
Figure 6 of
Hamou, Mol Vis 2025; 31:380-394.