Figure 1. The vitreous of patients with proliferative diabetic retinopathy (PDR) and diabetic macular edema (DME) contains proteins
that are significantly upregulated compared with control samples. A. Human angiogenic array membranes from surrogate controls (left membrane), diabetic macular edema (DME; middle membrane),
and proliferative diabetic retinopathy (PDR; right membrane) vitreous samples. Numerals represent angiogenic proteins. 1.
CCL2. 2. CXCL5. 3. Angiogenin. Asterisks indicate positive controls. B. Bar graphs showing the proteins that are upregulated in the vitreous from patients with DME (gray bars) and PDR (black bars).
The data are presented in the order of change in protein expression over surrogate controls. Asterisks indicate the proteins
whose expression is significantly upregulated twofold, as indicated by the dashed line. The vitreous of patients with PDR
presented a twofold increase in CCL2, CXCL5, and angiogenin. *p < 0.05. **p < 0.01.
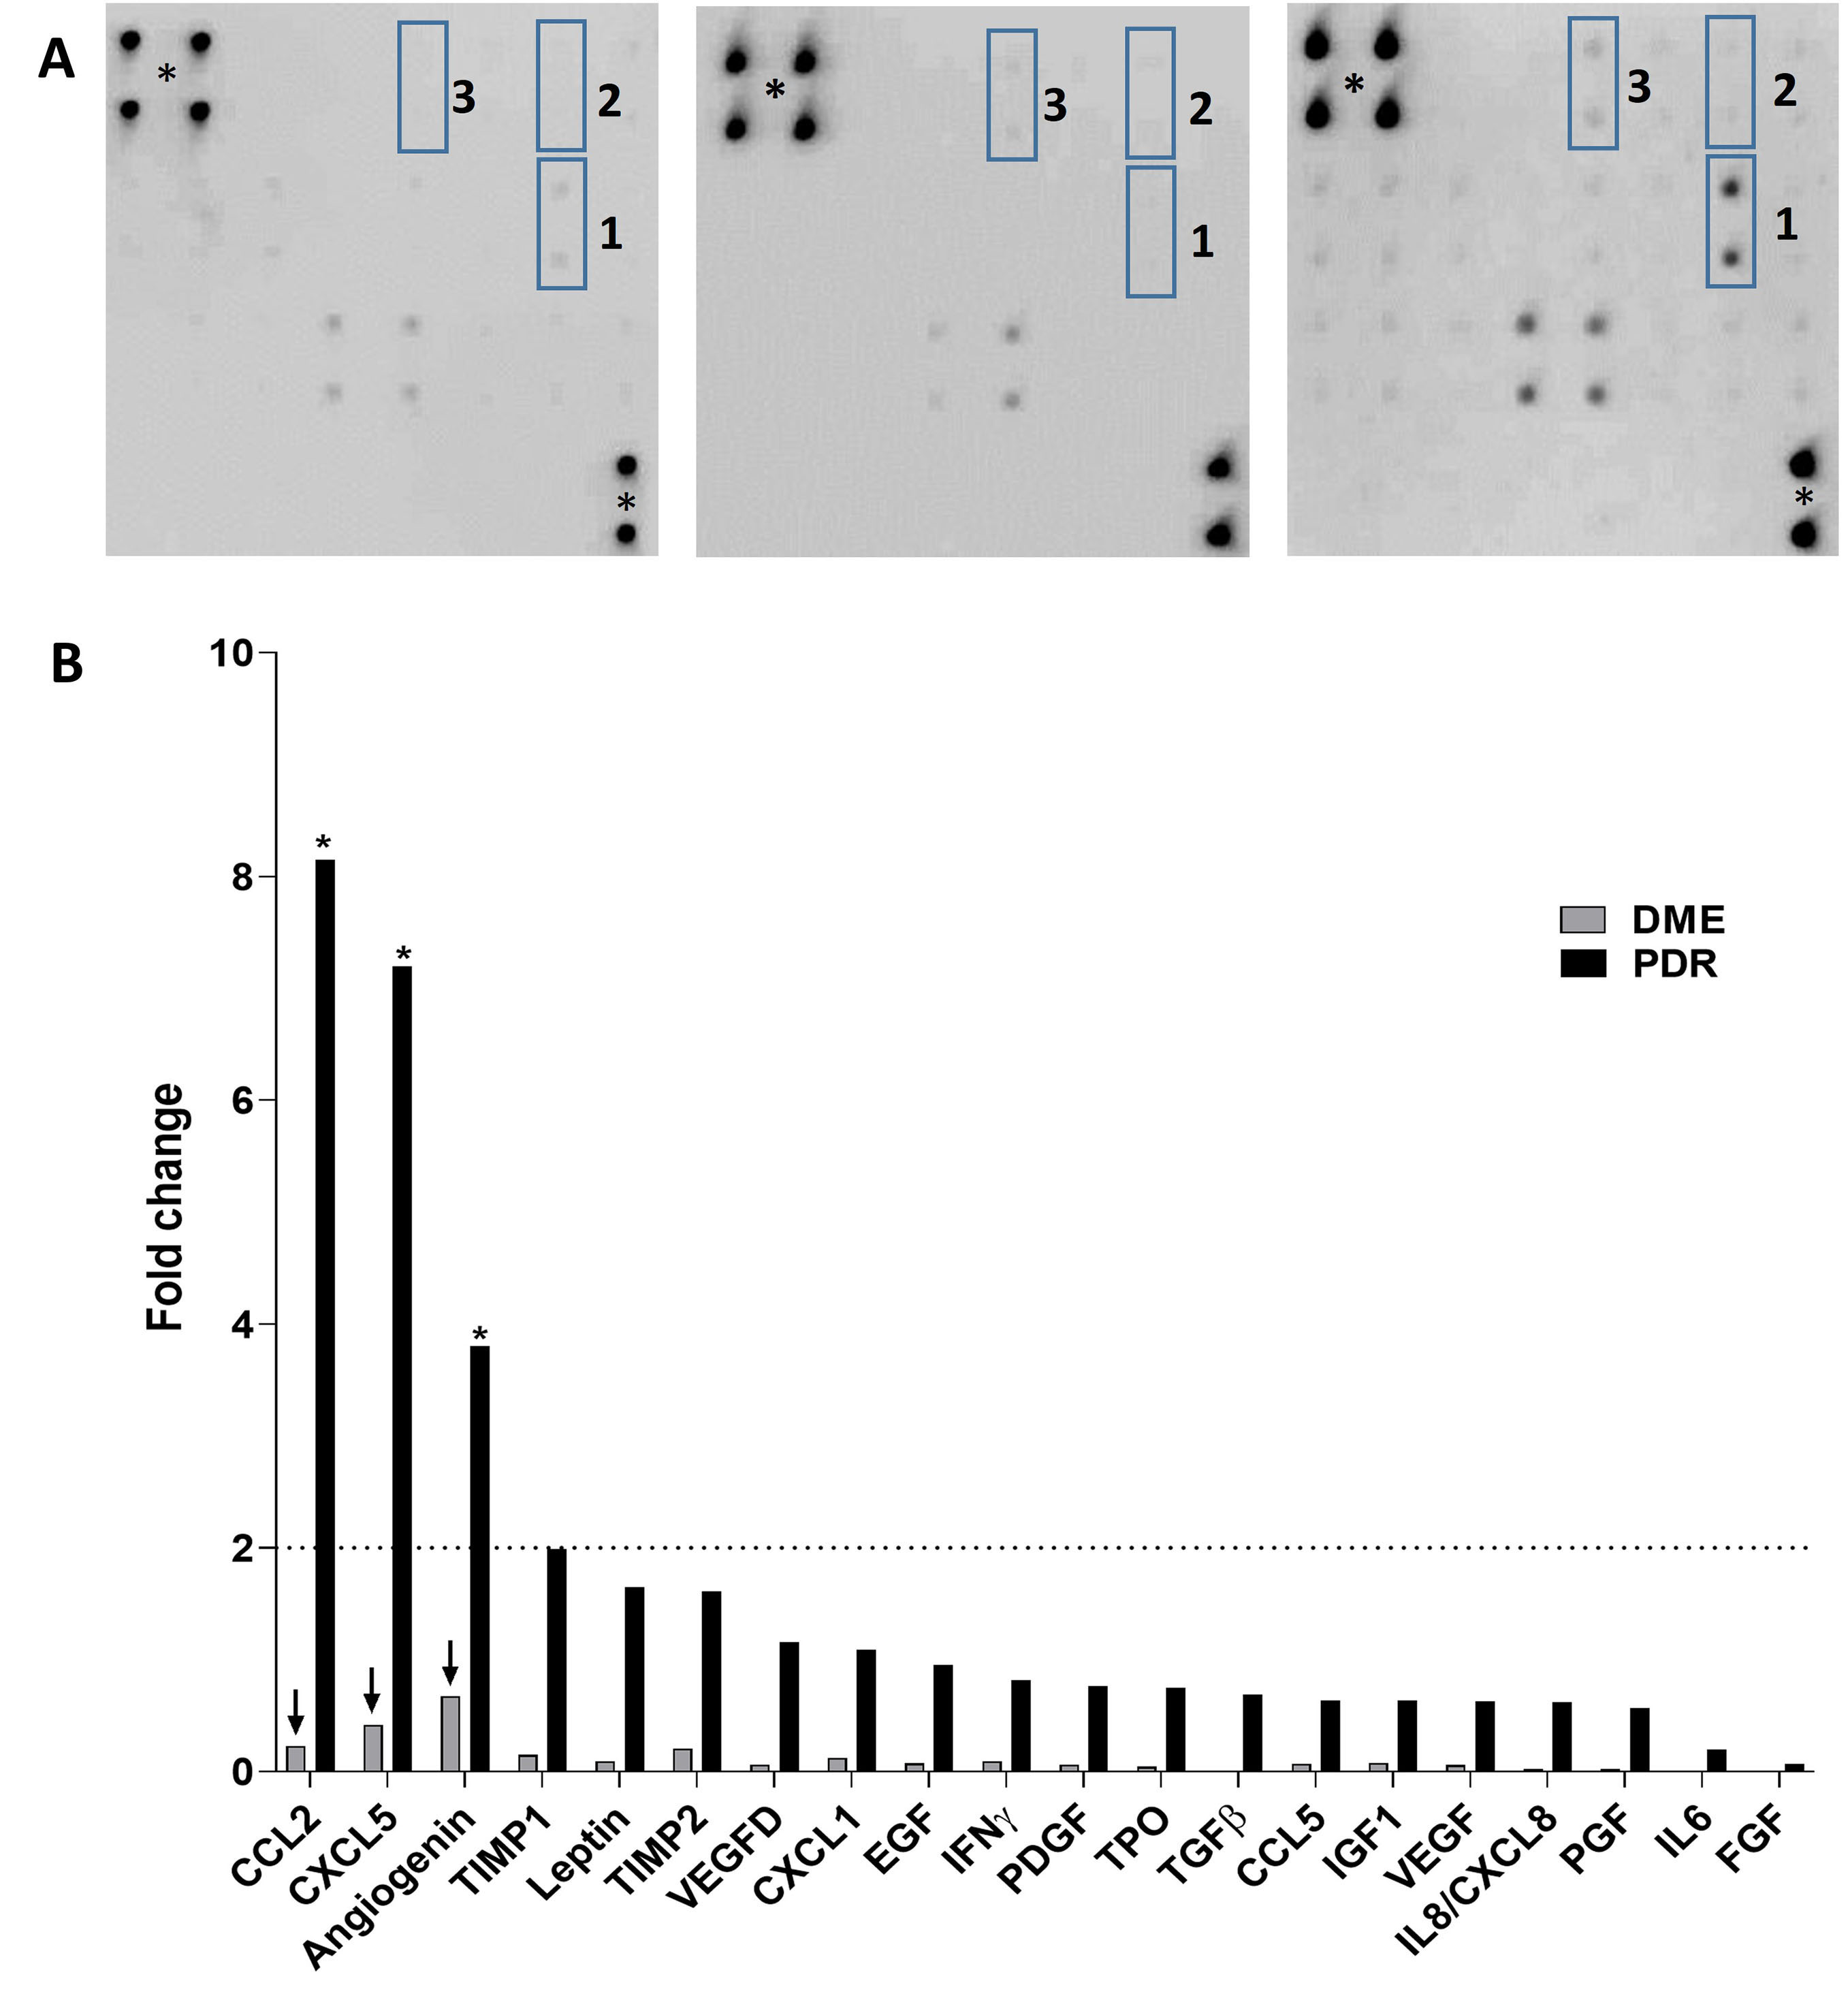
 Figure 1 of
Magaña-Guerrero, Mol Vis 2025; 31:368-378.
Figure 1 of
Magaña-Guerrero, Mol Vis 2025; 31:368-378.