Figure 6. Neuronal and vascular analyses after exposure to ischemia/reperfusion (I/R). Mice are untreated (ctrl), exposed to I/R only
(IR), treated with AF38469 only (AF38469), or exposed to I/R and treated with AF38469 eye drops. A. A representative image of neuronal changes. B. Number of cells in the ganglion cell layer. C. Retinal thickness. D. A representative image of the vascular changes showing degenerate capillaries. E. Counts of acellular capillaries. n = 5 in all groups. *p < 0.05 versus Ctrl, #p < 0.05 versus IR only, as measured by one-way analysis of variance, followed by Tukey’s test. Data are mean ± SEM. Scale bar for neuronal analyses is 50 μm.
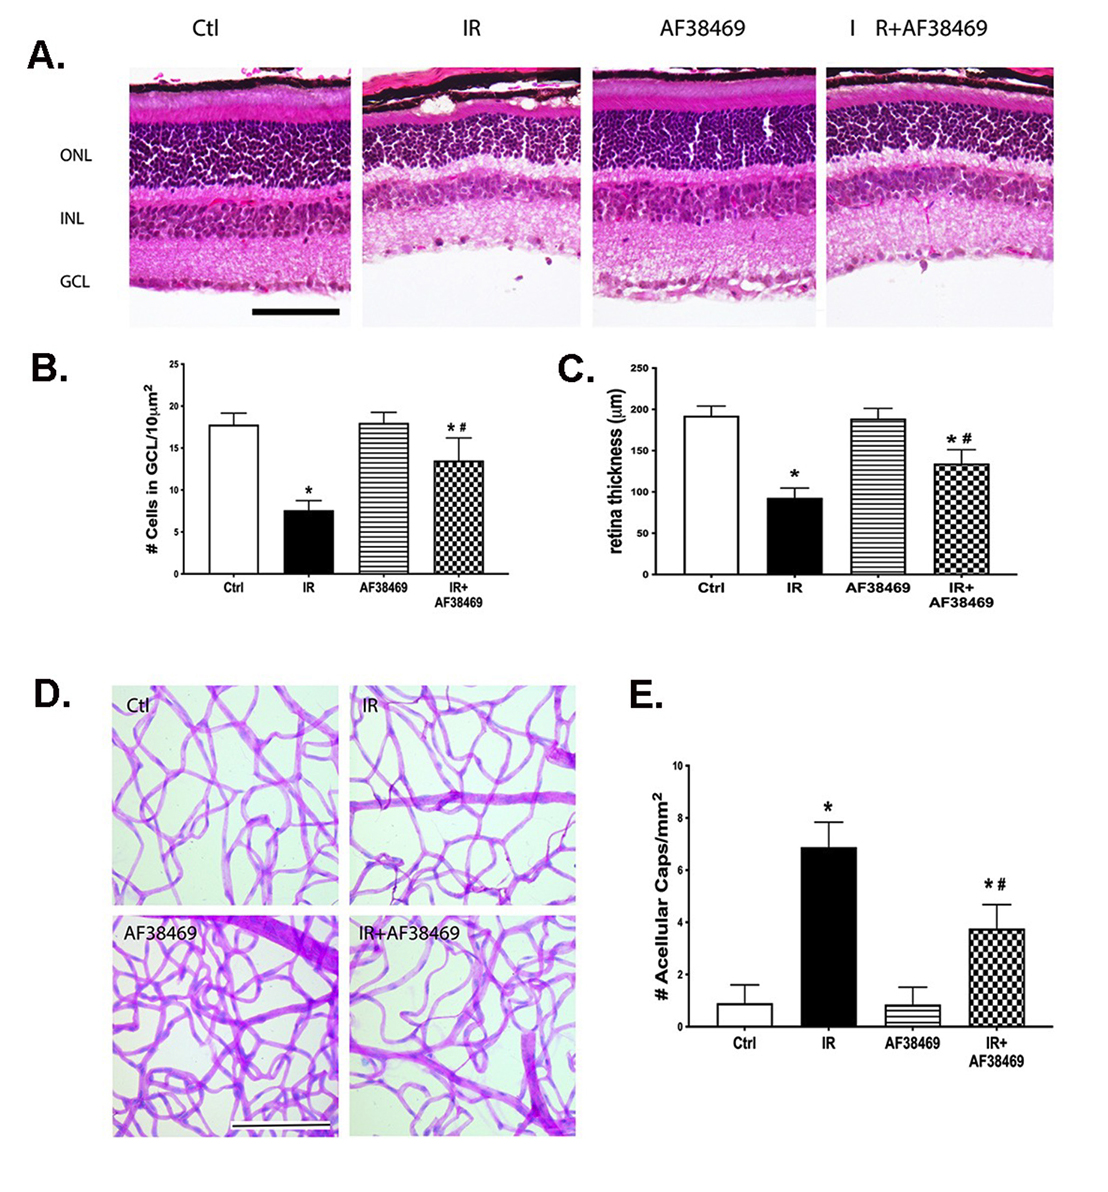
 Figure 6 of
Liu, Mol Vis 2025; 31:359-366.
Figure 6 of
Liu, Mol Vis 2025; 31:359-366.