Figure 5. Autophagy and apoptotic markers in Muller cells. LAMP2 (A) and cleaved caspase 3 (C) levels in human Müller cells and rat Müller cells (B, D, respectively) grown in normal glucose (NG) and high glucose (HG) alone and treated with AF38469. *p < 0.05 versus NG, #p < 0.05 versus HG, assessed using a one-way analysis of variance. n = 4.
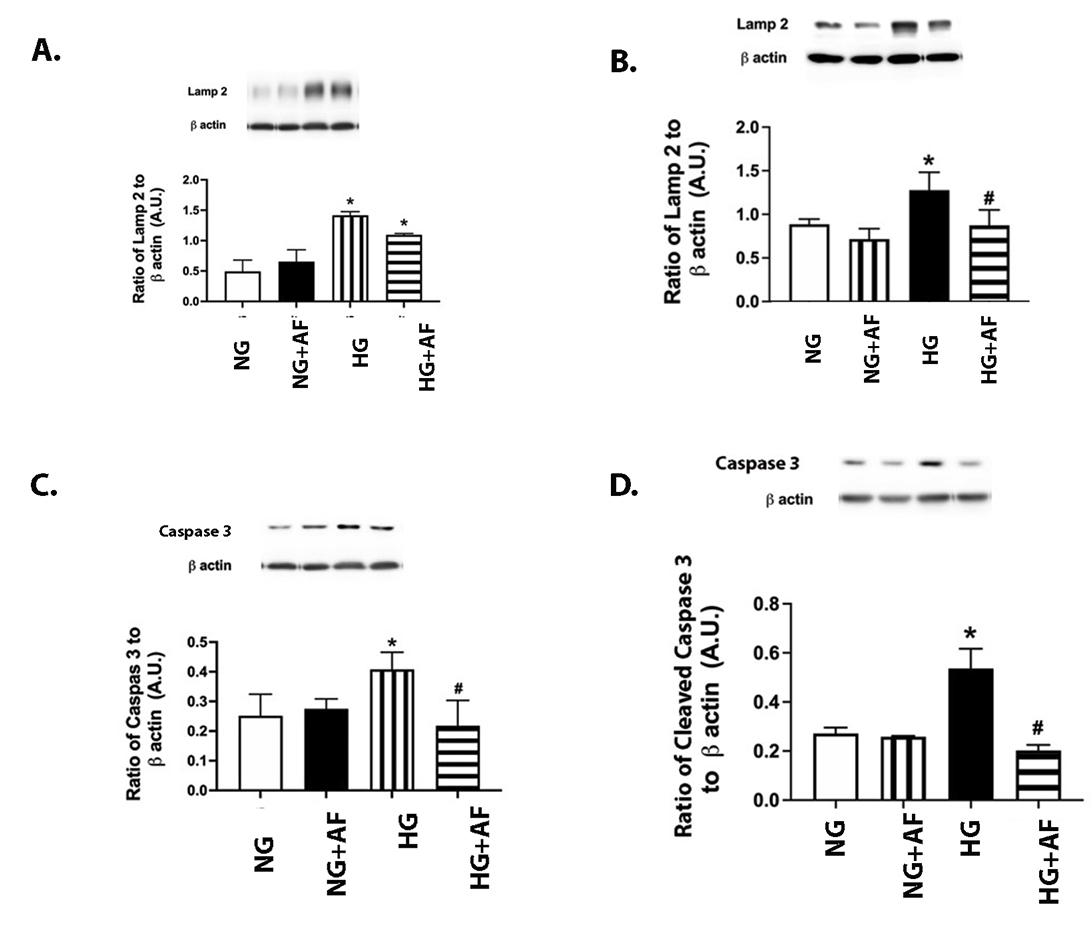
 Figure 5 of
Liu, Mol Vis 2025; 31:359-366.
Figure 5 of
Liu, Mol Vis 2025; 31:359-366.