Figure 5. Effect of nitazoxanide and glucose concentration on mitochondrial properties. A. Relative OCR levels were measured in a Seahorse XFe24 Bioanalyzer for RECs grown in normal (5 mM) or high (25 mM) glucose
alone or treated with NZT. *p < 0.05 versus NG, #p < 0.05 versus HG by one-way analysis of variance (ANOVA). n = 3. B. Lysates of RECs grown as in (A) were separated on a sodium dodecyl sulfate–polyacrylamide gel electrophoresis gel and probed
for Tom20 protein. *p < 0.05 versus NG, #p < 0.05 versus HG by two-way ANOVA. n = 3.
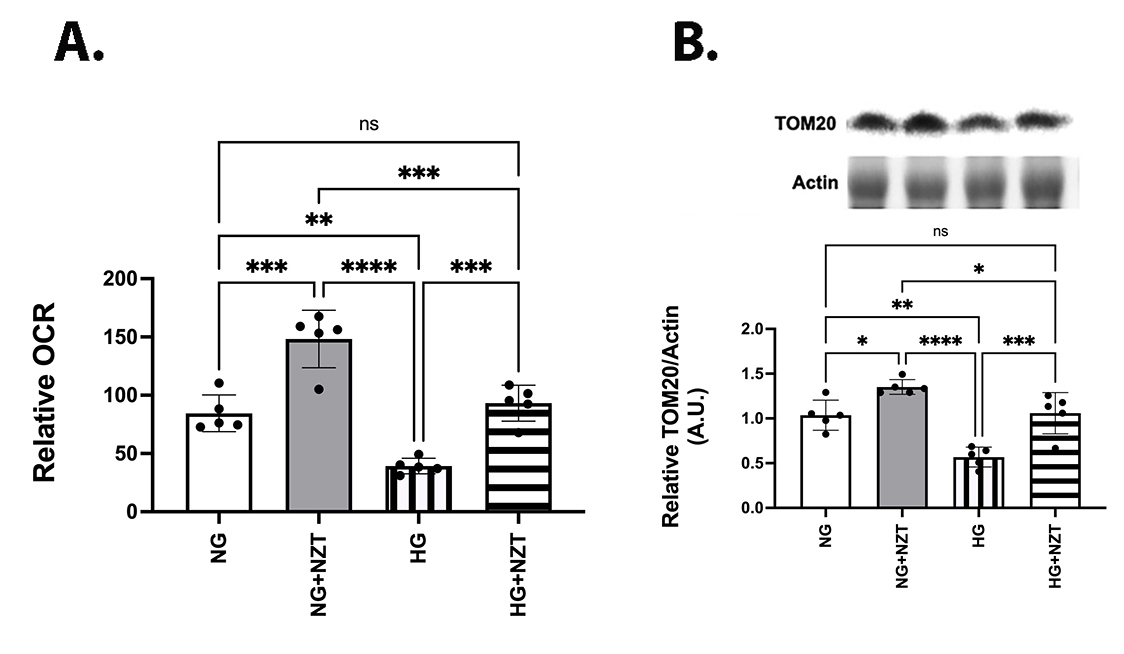
 Figure 5 of
Jiang, Mol Vis 2025; 31:351-357.
Figure 5 of
Jiang, Mol Vis 2025; 31:351-357.