Figure 4. Effect of nitazoxanide and glucose concentration on inflammatory mediators. Lysates of RECs grown in normal glucose (NG) and
high glucose (HG) ± NTZ were separated on a sodium dodecyl sulfate–polyacrylamide gel electrophoresis gel and probed for markers
of inflammation. Gel images and their quantitation are shown. (A) TNFα, (B) HMGB1, (C) NLRP3, and (D) IL-1β. *p < 0.05 versus NG, #p < 0.05 versus HG assessed by one-way analysis of variance. n = 4.
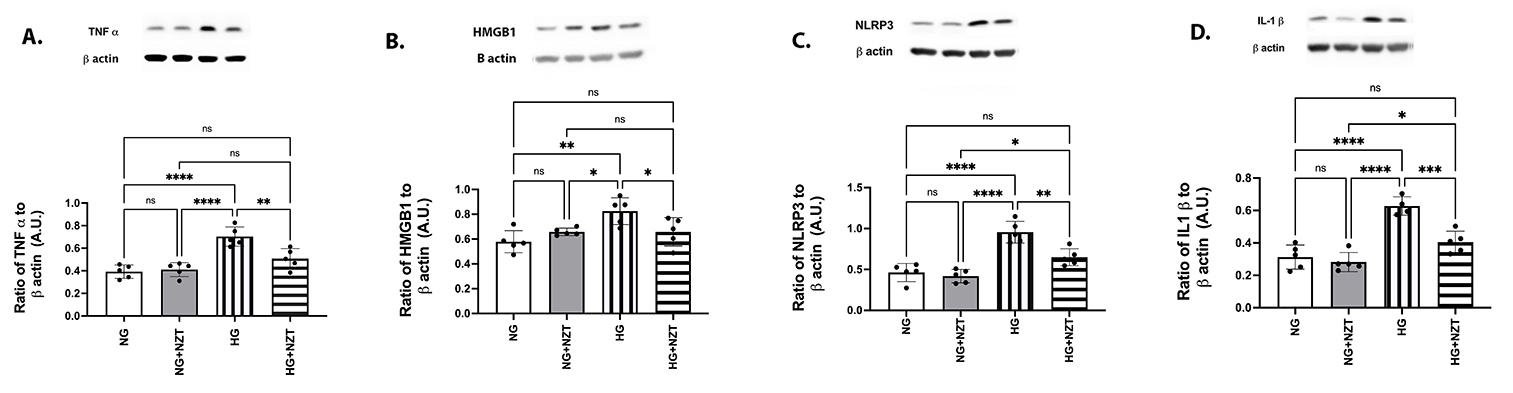
 Figure 4 of
Jiang, Mol Vis 2025; 31:351-357.
Figure 4 of
Jiang, Mol Vis 2025; 31:351-357.