Figure 3. Effect of nitazoxanide and glucose concentration on MNRR1 levels. Cell lysates of control and NZT (20 μM)–treated RECs grown
in normal (NG, 5 mM) or high (HG, 25 mM) glucose were separated on a sodium dodecyl sulfate–polyacrylamide gel electrophoresis
gel and probed for MNRR1 and β-actin. Gel images and their quantitation are shown. *p < 0.05 versus NG, #p < 0.05 versus HG by one way-analysis of variance. n = 4.
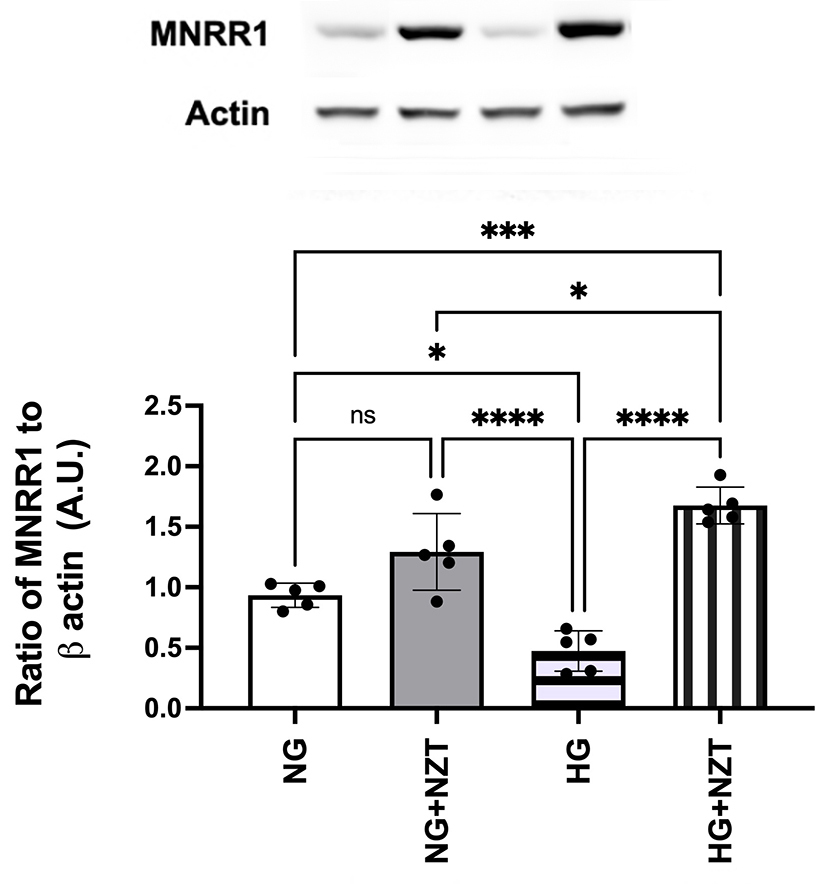
 Figure 3 of
Jiang, Mol Vis 2025; 31:351-357.
Figure 3 of
Jiang, Mol Vis 2025; 31:351-357.