Figure 1. MNRR1 levels in whole retinal lysates from control and diabetic patients. Retinal lysates were separated on a sodium dodecyl
sulfate–polyacrylamide gel electrophoresis gel and probed for MNRR1 and β-actin. Gel images and their quantitation are shown.
(A) Control and (B) diabetic mice. *p < 0.05 versus ctrl measured by t test. n = 5 for all groups.
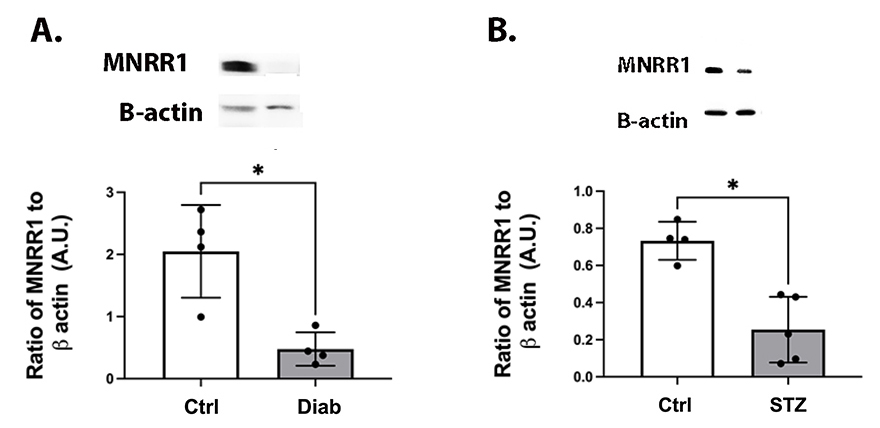
 Figure 1 of
Jiang, Mol Vis 2025; 31:351-357.
Figure 1 of
Jiang, Mol Vis 2025; 31:351-357.