Figure 8. An example of optical coherence tomography (OCT) live imaging of the anole retina. The left image shows a histological section
through the anole fovea. The right image shows OCT imaging through the anole eye. The nuclear layers (outer nuclear layer
[ONL], inner nuclear layer [INL], and ganglion cell layer [GCL]) and the nerve fiber layer (NFL) in the OCT image line up
with the layers in the histology image next to it.
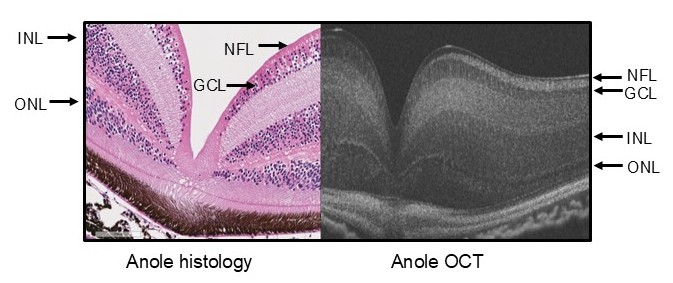
 Figure 8 of
Gregory-Evans, Mol Vis 2025; 31:319-343.
Figure 8 of
Gregory-Evans, Mol Vis 2025; 31:319-343.