Figure 1. Optical coherence tomography (OCT) imaging in foveal hypoplasia (FH) cases. A: An OCT scan through a normal retina at the fovea. GCL, ganglion cell layer; INL, inner nuclear layer; ONL, outer nuclear
layer. The yellow arrows define the size of the fovea. The green arrows show the size of the foveola in the center of the
fovea. The red arrow denotes the outer segment lengthening feature of the fovea, seen as an upward bend in the hyperreflective
ellipsoid zone band. B: This image shows grade 3 FH. The white arrow denotes the outer segment widening feature of the fovea. C: This image shows grade 4 FH with a typical flat retina (fovea plana) with no features of a normal fovea. D: This image shows atypical grade 1 FH with a shallow foveal pit but no outer segment lengthening. This image is from the
daughter of the person in image C. E: An OCT angiography (OCTA) scan at the level of the superficial plexus in a retina with a normal foveal avascular zone (FAZ)
indicated by a white arrow. F: An OCTA scan in a patient with FH showing the absence of the FAZ.
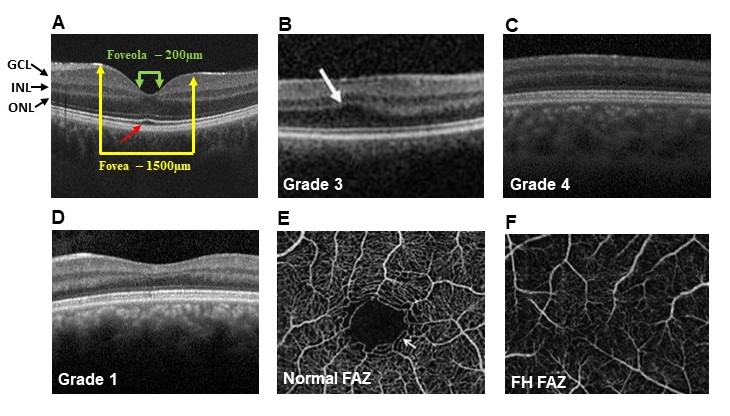
 Figure 1 of
Gregory-Evans, Mol Vis 2025; 31:319-343.
Figure 1 of
Gregory-Evans, Mol Vis 2025; 31:319-343.