Figure 2. The clinical phenotype of proband (III). A and B images show macular OCT: thinning of the nerve fibre layer thickness in the macula; C: OD ILM-PRE thickness, fovea centralis (depression in the macular retina, most sensitive optic region): 248, 76; D: OS ILM-PRE thickness, fovea centralis (depression in the macular retina, most sensitive optic region): 249, 72; E: OCT fundus for OD (including choroid, retina, optic nerve, etc.); F: OCT fundus for OS (including choroid, retina, optic nerve, etc.); G: Brightness-mode ultrasound for OD; H: Brightness-mode Ultrasound for OS; I and J images demonstrate tubular visual field.
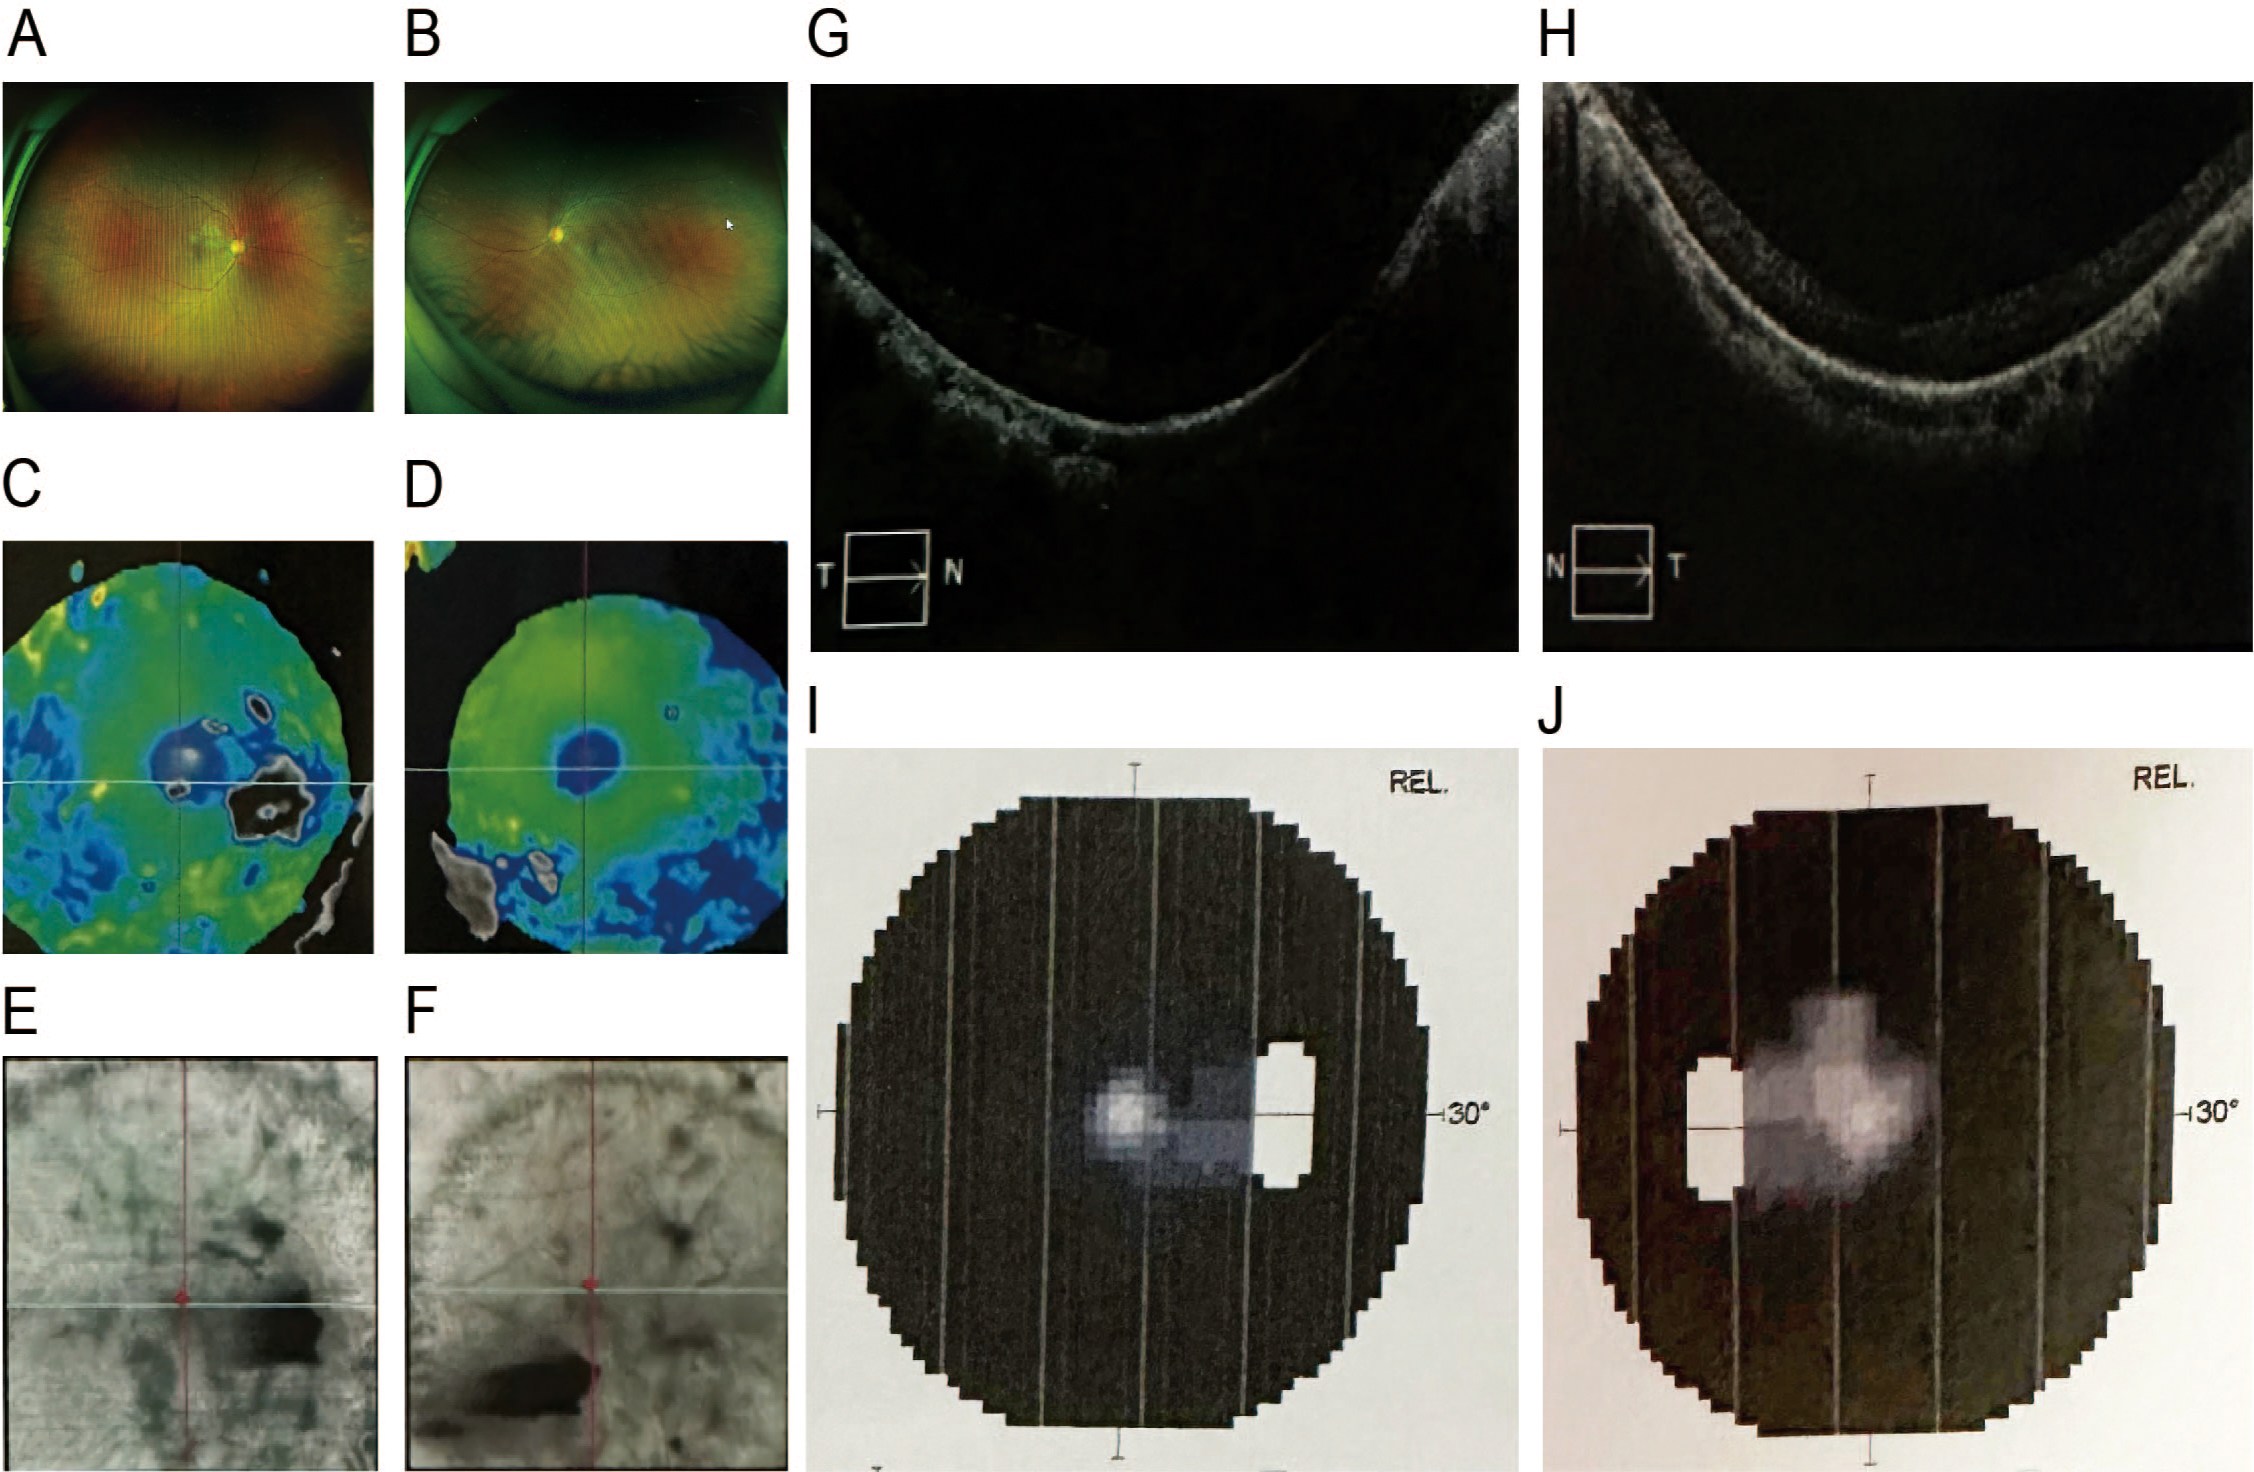
 Figure 2 of
Liu, Mol Vis 2025; 31:282-295.
Figure 2 of
Liu, Mol Vis 2025; 31:282-295.