Figure 3. The fitting curve illustrating the relationship between IOP and age. The red line represents the polynomial fitting curve,
whereas the blue line represents the linear fitting curve. The table presents the fitting function, the residual sum of squares,
and the adjusted R-squared.
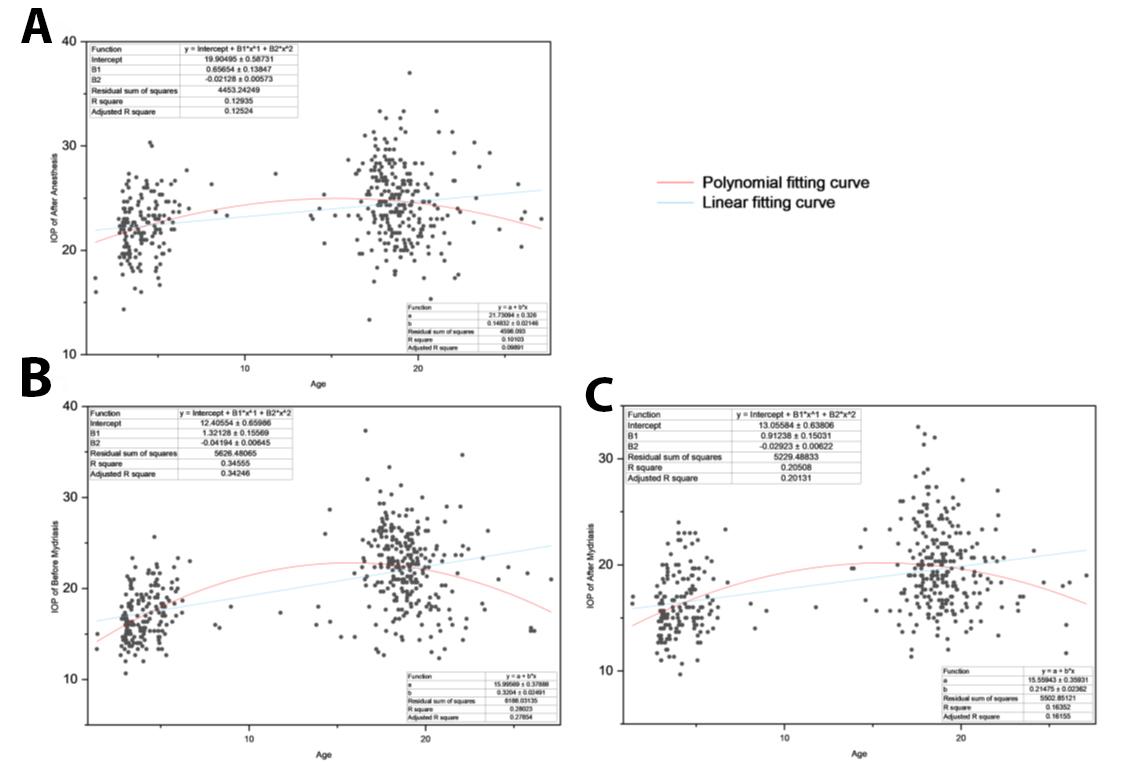
 Figure 3 of
Zhan, Mol Vis 2025; 31:276-282.
Figure 3 of
Zhan, Mol Vis 2025; 31:276-282.