Figure 2. The box plot shows the IOP (median, IQR, and outliers) of young monkeys (green) and old monkeys (blue) at three stages (after
anesthesia, before mydriasis, and after mydriasis). The distribution is described by scatterplots, and the trend is depicted
by line graphs.
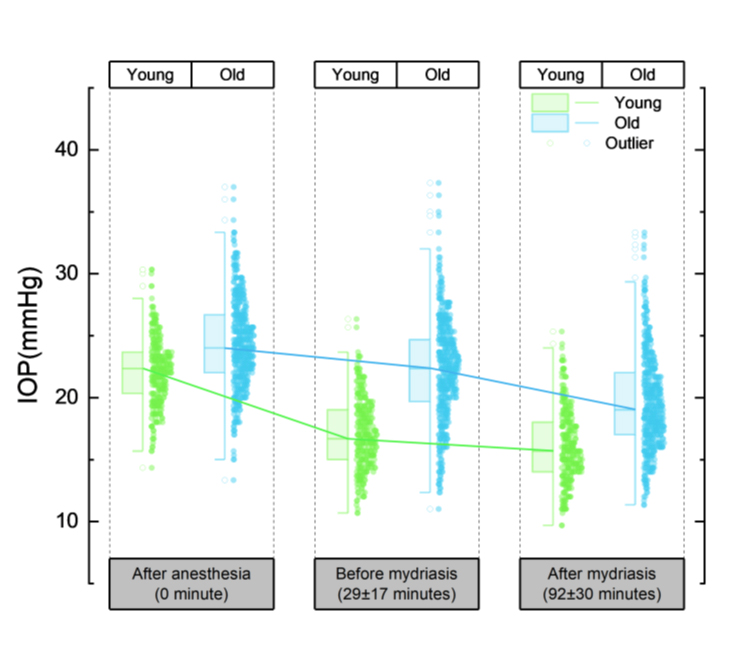
 Figure 2 of
Zhan, Mol Vis 2025; 31:276-282.
Figure 2 of
Zhan, Mol Vis 2025; 31:276-282.