Figure 1. Graphical representation of the extent of RB1 CNV identified in patients with retinoblastoma. The number of patients with the indicated change is given in brackets. A: Gross deletions and gains encompassing RB1. Horizontal black bars represent the extent of the deletion identified in array CGH analysis, and gray bars represent the
deletions within the 13q14.2 region identified by MLPA. B: Intragenic RB1 deletions and gains at the exonic level.
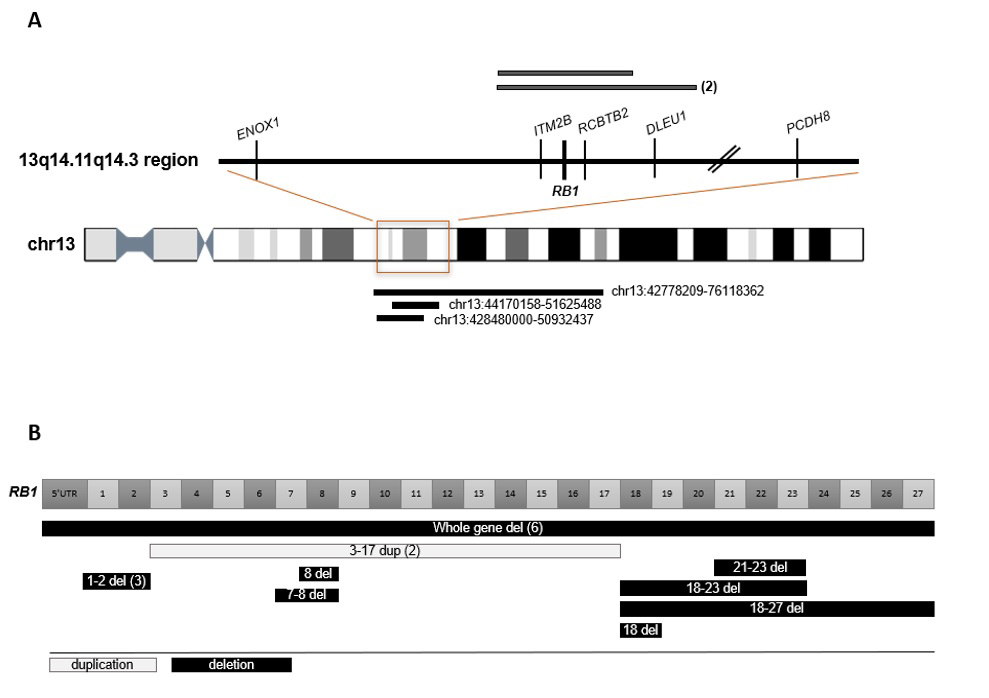
 Figure 1 of
Wicher, Mol Vis 2025; 31:267-274.
Figure 1 of
Wicher, Mol Vis 2025; 31:267-274.