Figure 2. High glucose levels affect the viability and intracellular glucose levels of retinal ECs and PCs. A: Relative and normalized number of viable ECs and PCs cultured for 1 day, 3 days, and 7 days under standard and high-glucose
conditions. B: Relative and normalized intracellular glucose levels in ECs and PCs cultured for 1 day, 3 days, and 7 days under standard
and high-glucose conditions. The data are presented as bar graphs ± SDs, n = 2-3. Two-way analysis of variance (main factors:
treatment and cell type) was performed. ****p < 0.0001, **p < 0.001, and *p < 0.05 for the standard glucose group versus the high-glucose group. RLU, relative luminescence unit.
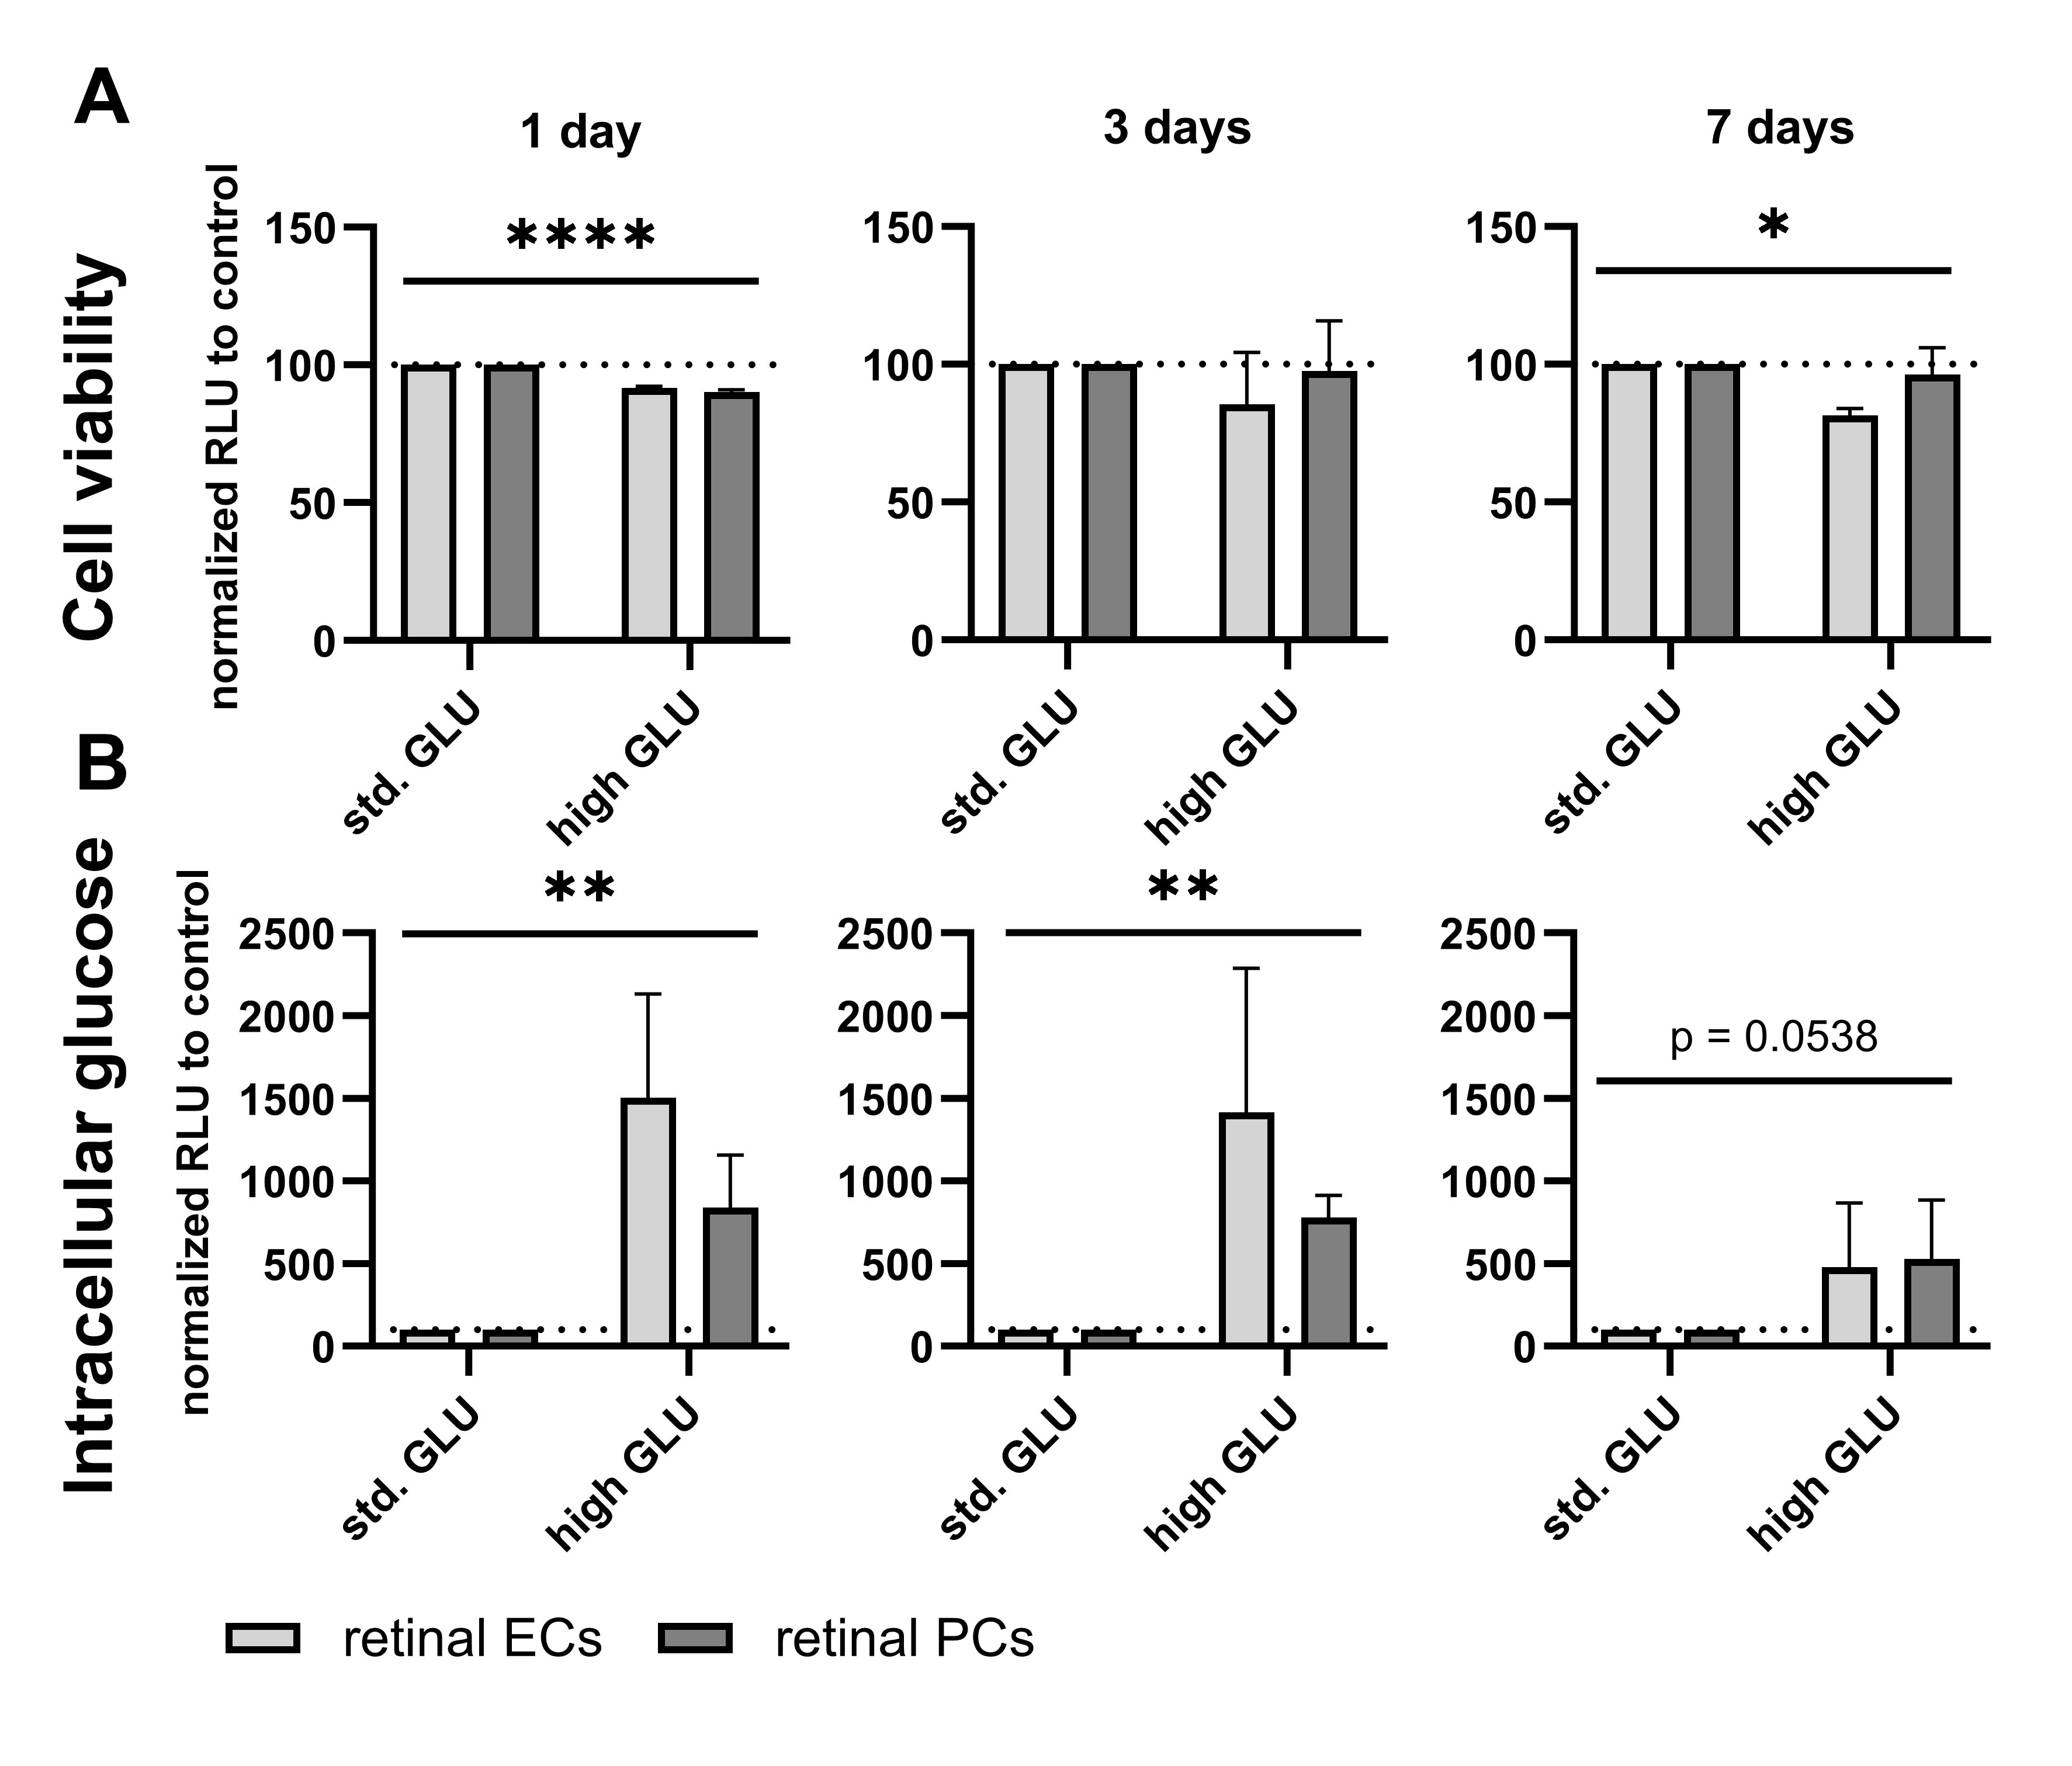
 Figure 2 of
Koller, Mol Vis 2025; 31:245-254.
Figure 2 of
Koller, Mol Vis 2025; 31:245-254.