Figure 5. Curve fit fourier-transform infrared spectroscopy (FTIR) spectra of different aggregate species. A: Curve-fitted primary spectrum of monomers. B: Curve-fitted primary spectrum of oligomers. C: Curve-fitted primary spectrum of fibrils. The spectra of all three species differ from one another.
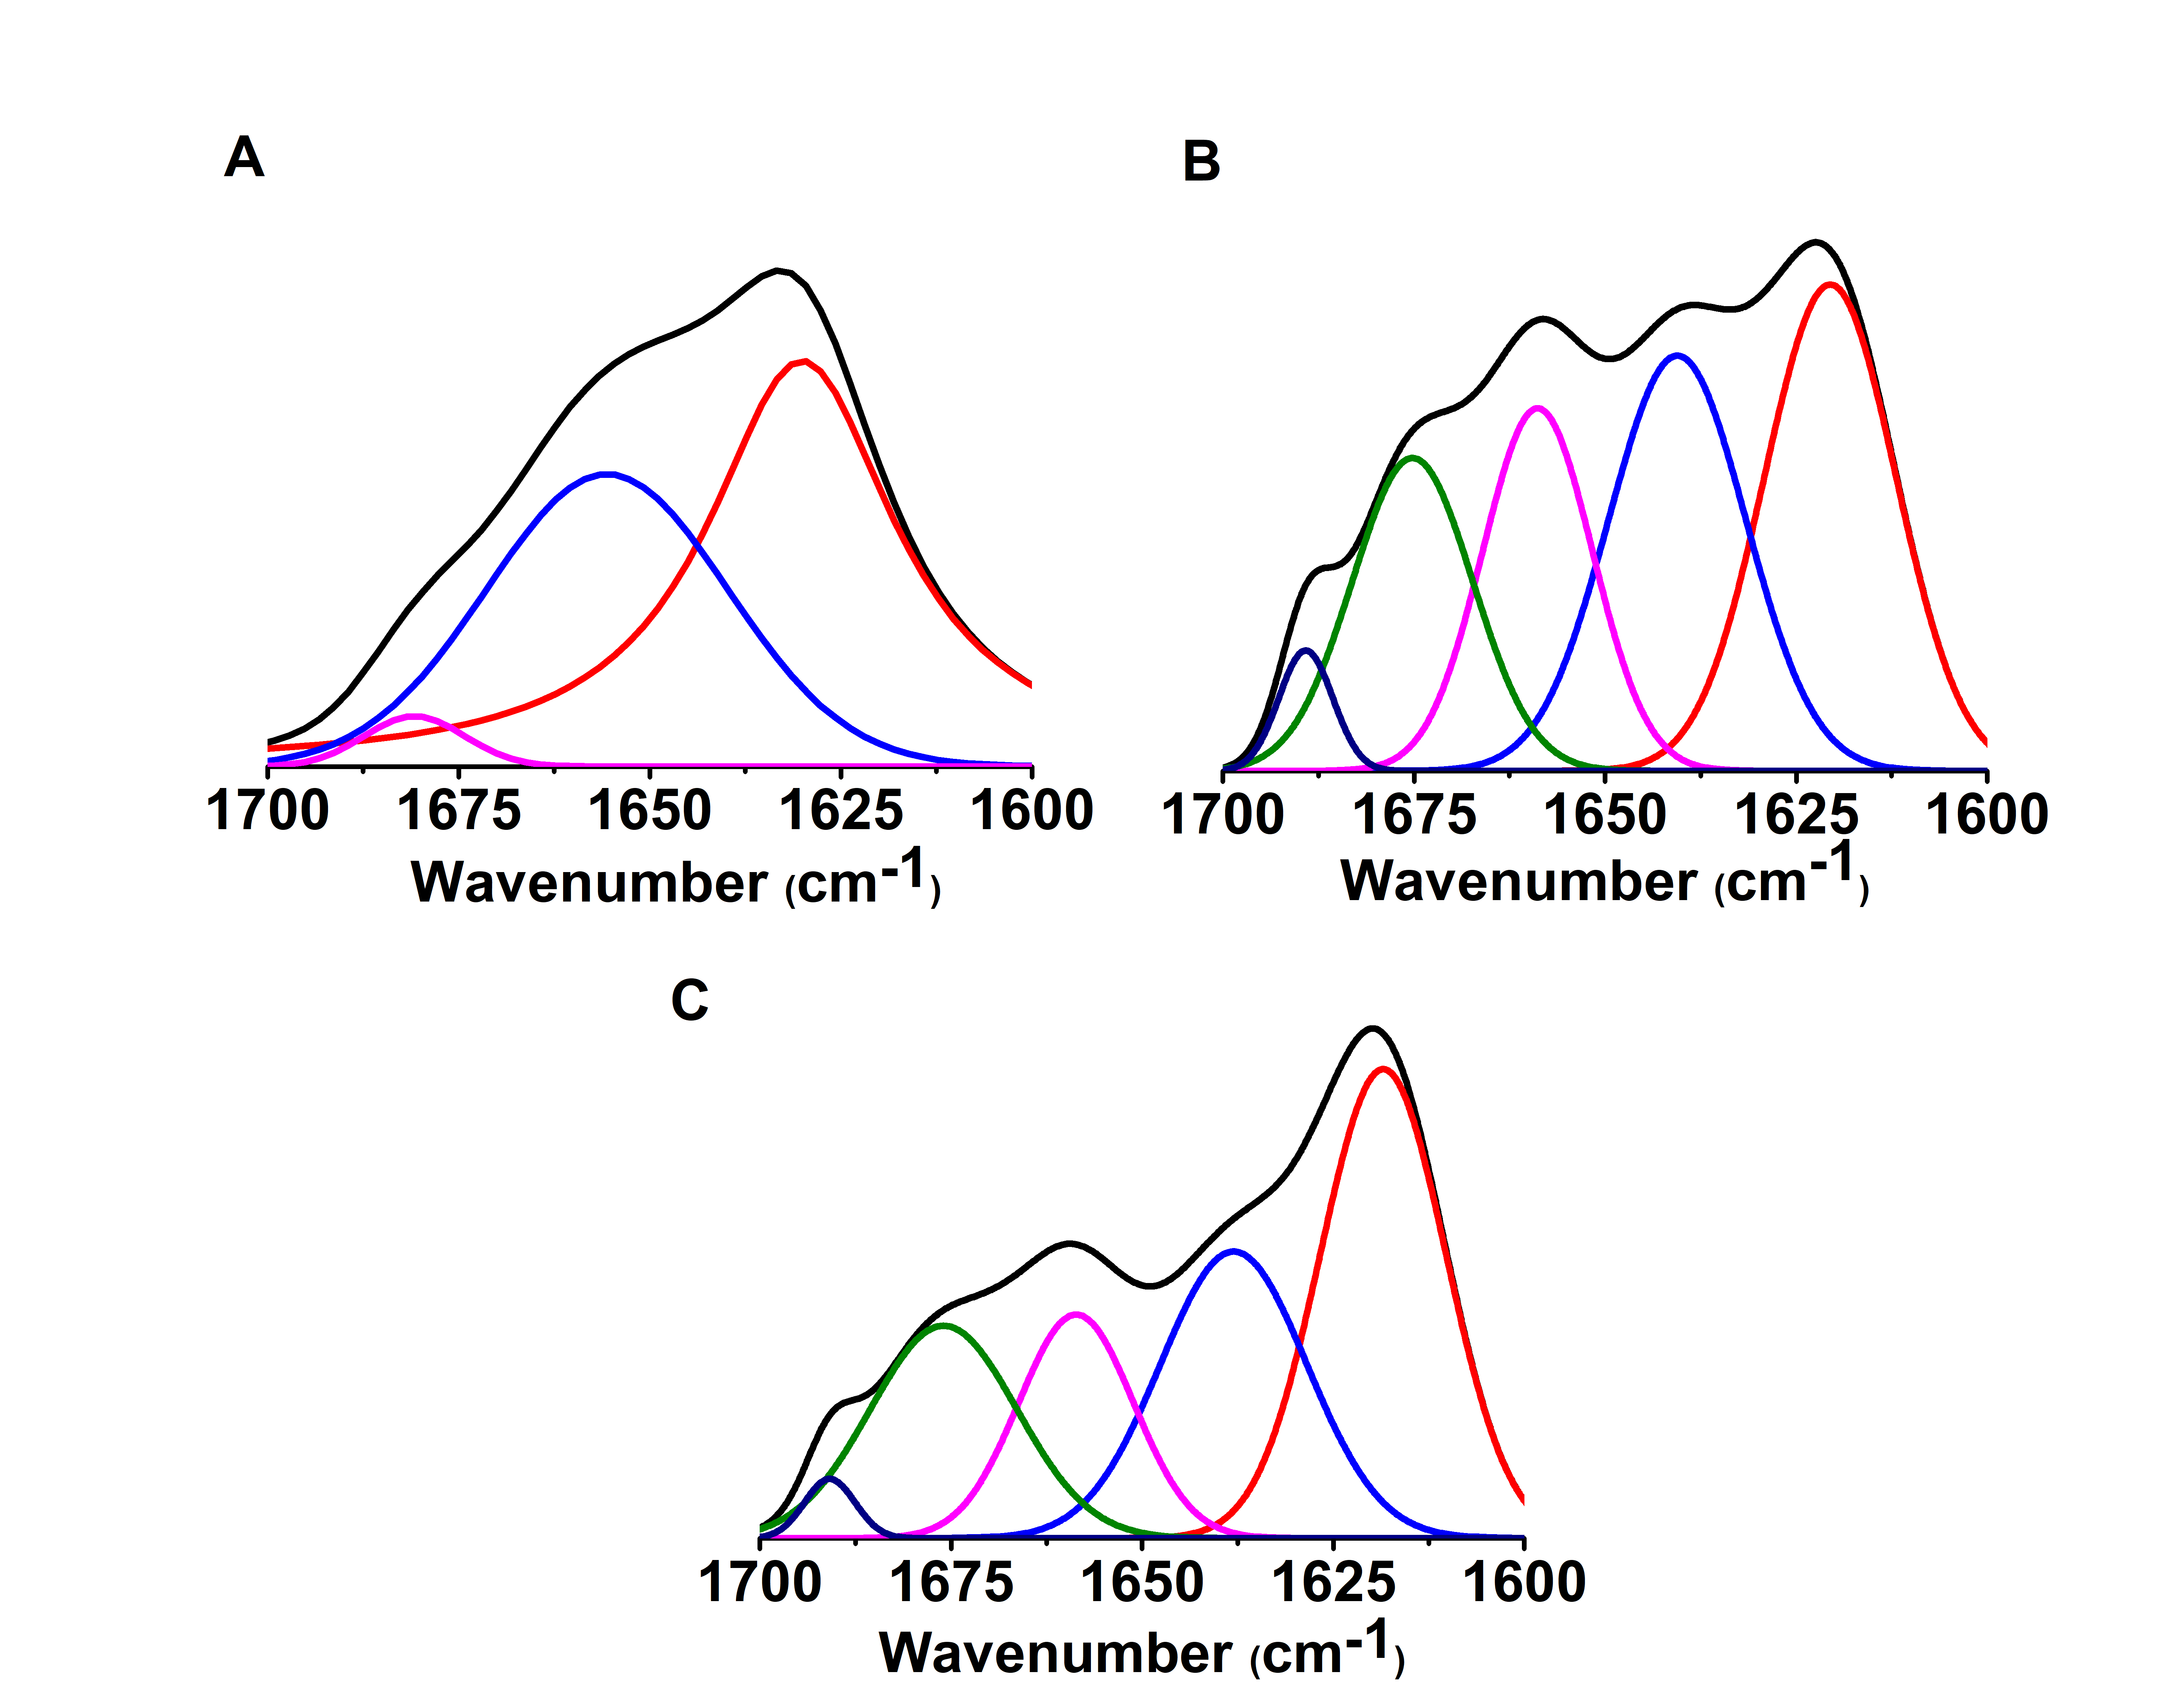
 Figure 5 of
Bawankar, Mol Vis 2025; 31:231-243.
Figure 5 of
Bawankar, Mol Vis 2025; 31:231-243.