Figure 3. Transmission electron microscopy (TEM) images of γD-crystallin aggregation at different time points during the aggregation
reaction. Oligomers were observed at 1.5 h (indicated by the black arrow), which grew to form protofibrils at 3 hours and
fibrils at 5 h and 30 h. The scale bar represents 100 nm.
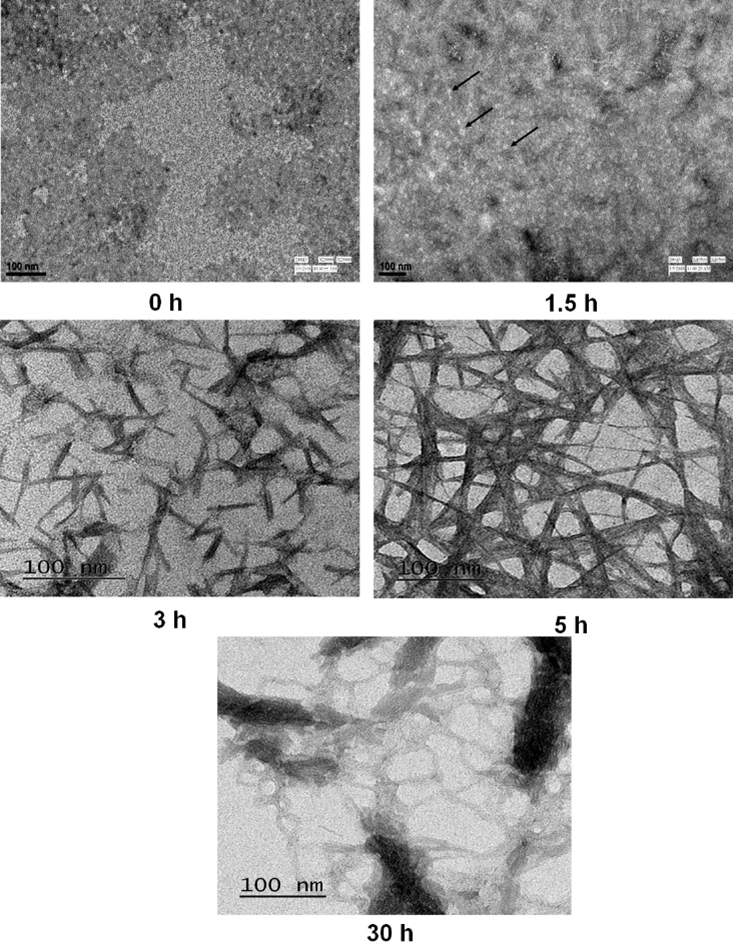
 Figure 3 of
Bawankar, Mol Vis 2025; 31:231-243.
Figure 3 of
Bawankar, Mol Vis 2025; 31:231-243.