Figure 2. Fluorescence correlation spectroscopy (FCS) analysis of γD-crystallin protein aggregation at pH 2.5. A: The radius of the aggregation intermediates formed during the aggregation pathway at pH 2.5, calculated using diffusion
time with equations 4 and 5. B: Best-fit lines (black) of autocorrelation curves (circles) representing aggregate species at different time points. To avoid
overcrowding of data, the FCS traces for 6 min, 27 min, and 35 min are not shown.
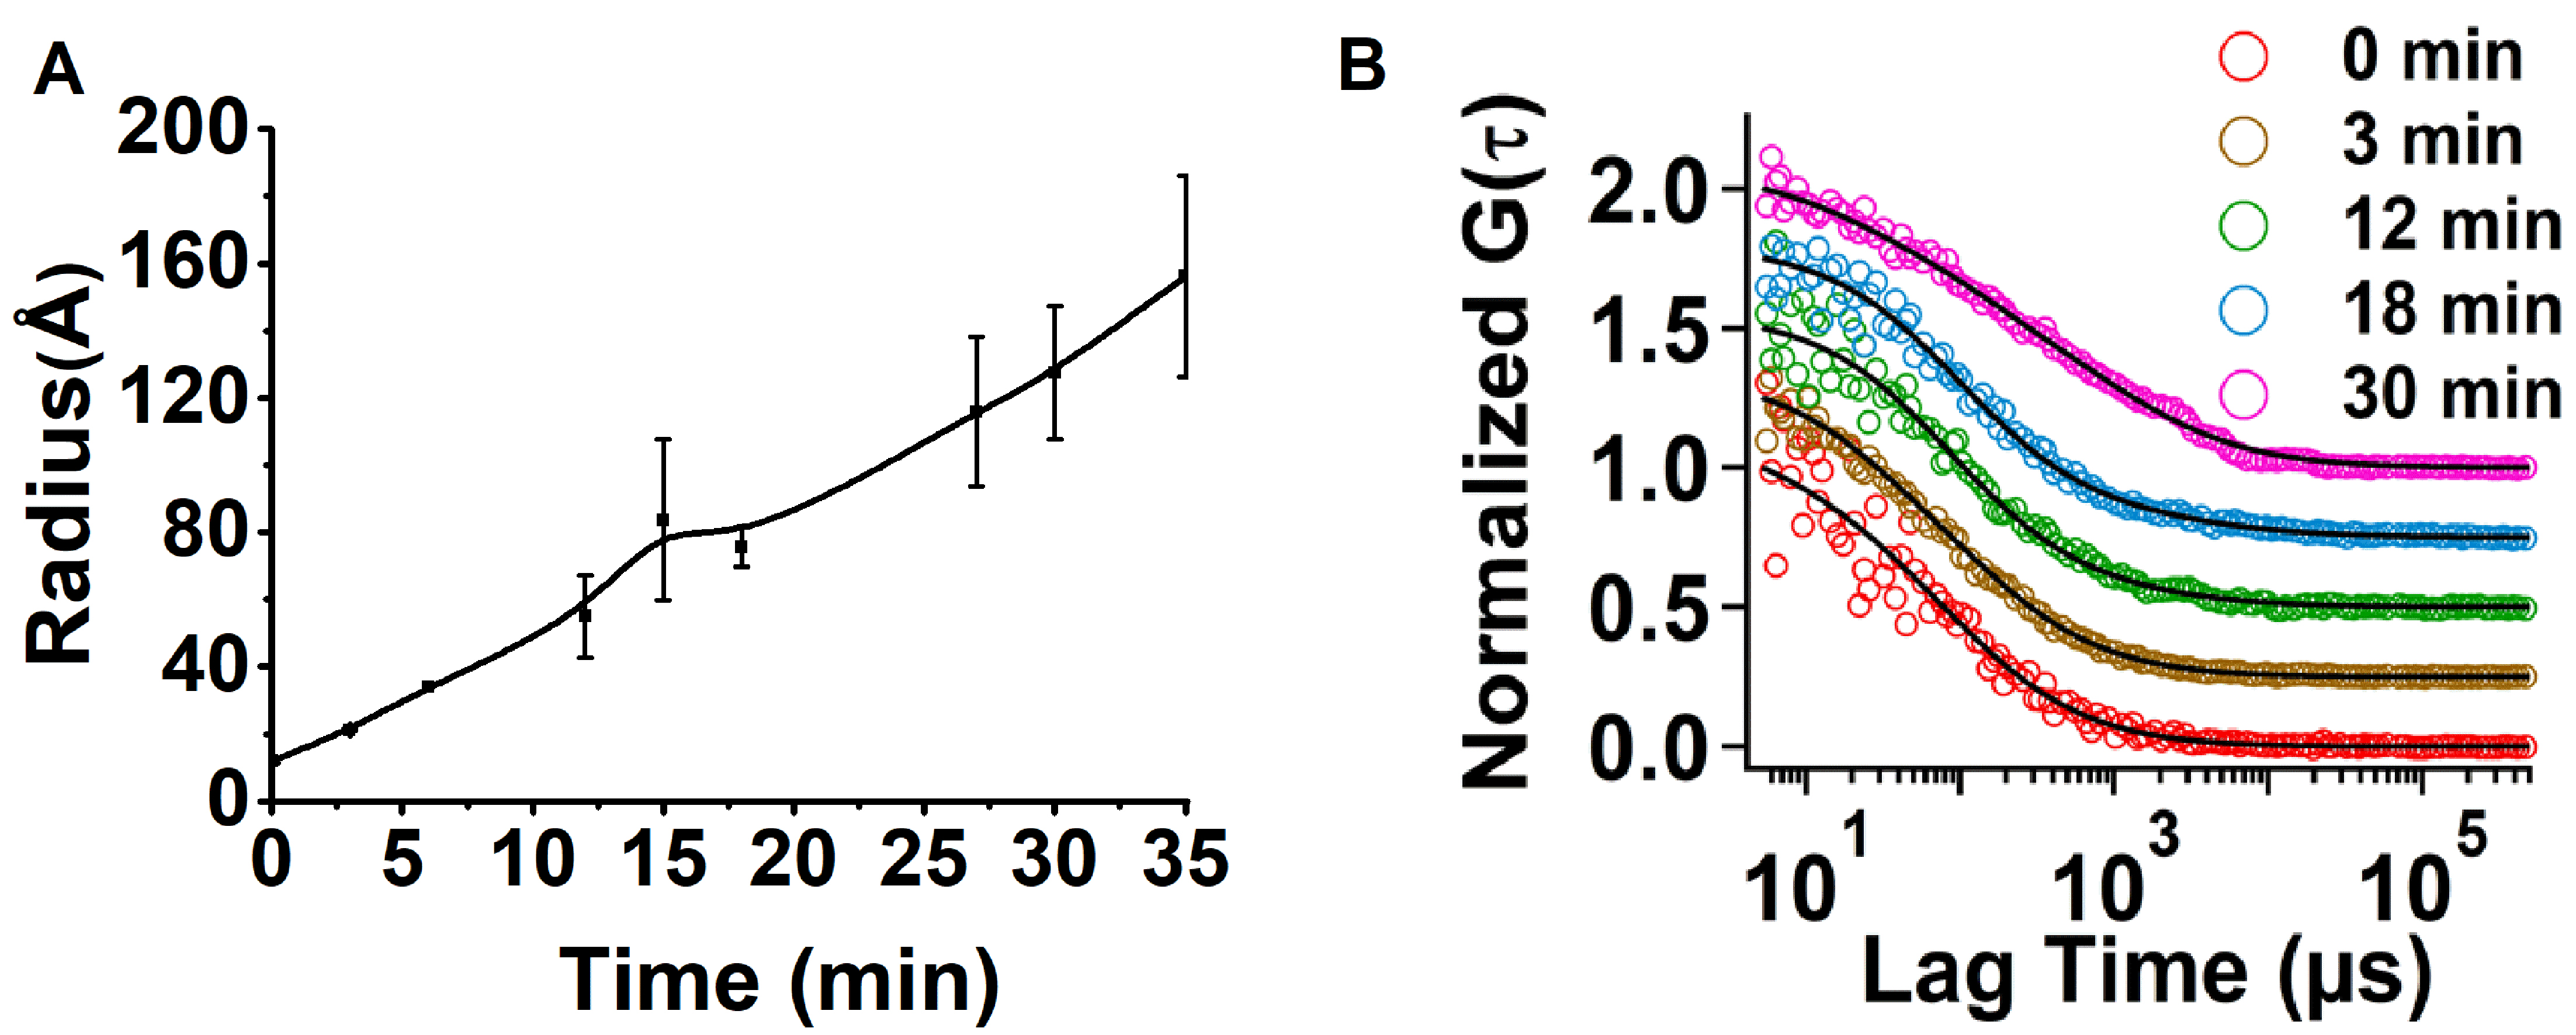
 Figure 2 of
Bawankar, Mol Vis 2025; 31:231-243.
Figure 2 of
Bawankar, Mol Vis 2025; 31:231-243.