Figure 1. Aggregation kinetics of γD-crystallin protein at pH 2.5. The black line represents the RP-HPLC sedimentation assay, the red
line represents the Thioflavin-T (ThT) binding assay, and the blue line represents the light scattering of γD-crystallin.
In the RP-HPLC sedimentation assay, the percentage of monomers was converted into the percentage of aggregates, while the
intensity values of light scattering and the ThT binding assay were normalized, considering the intensity value at 18 h as
100%.
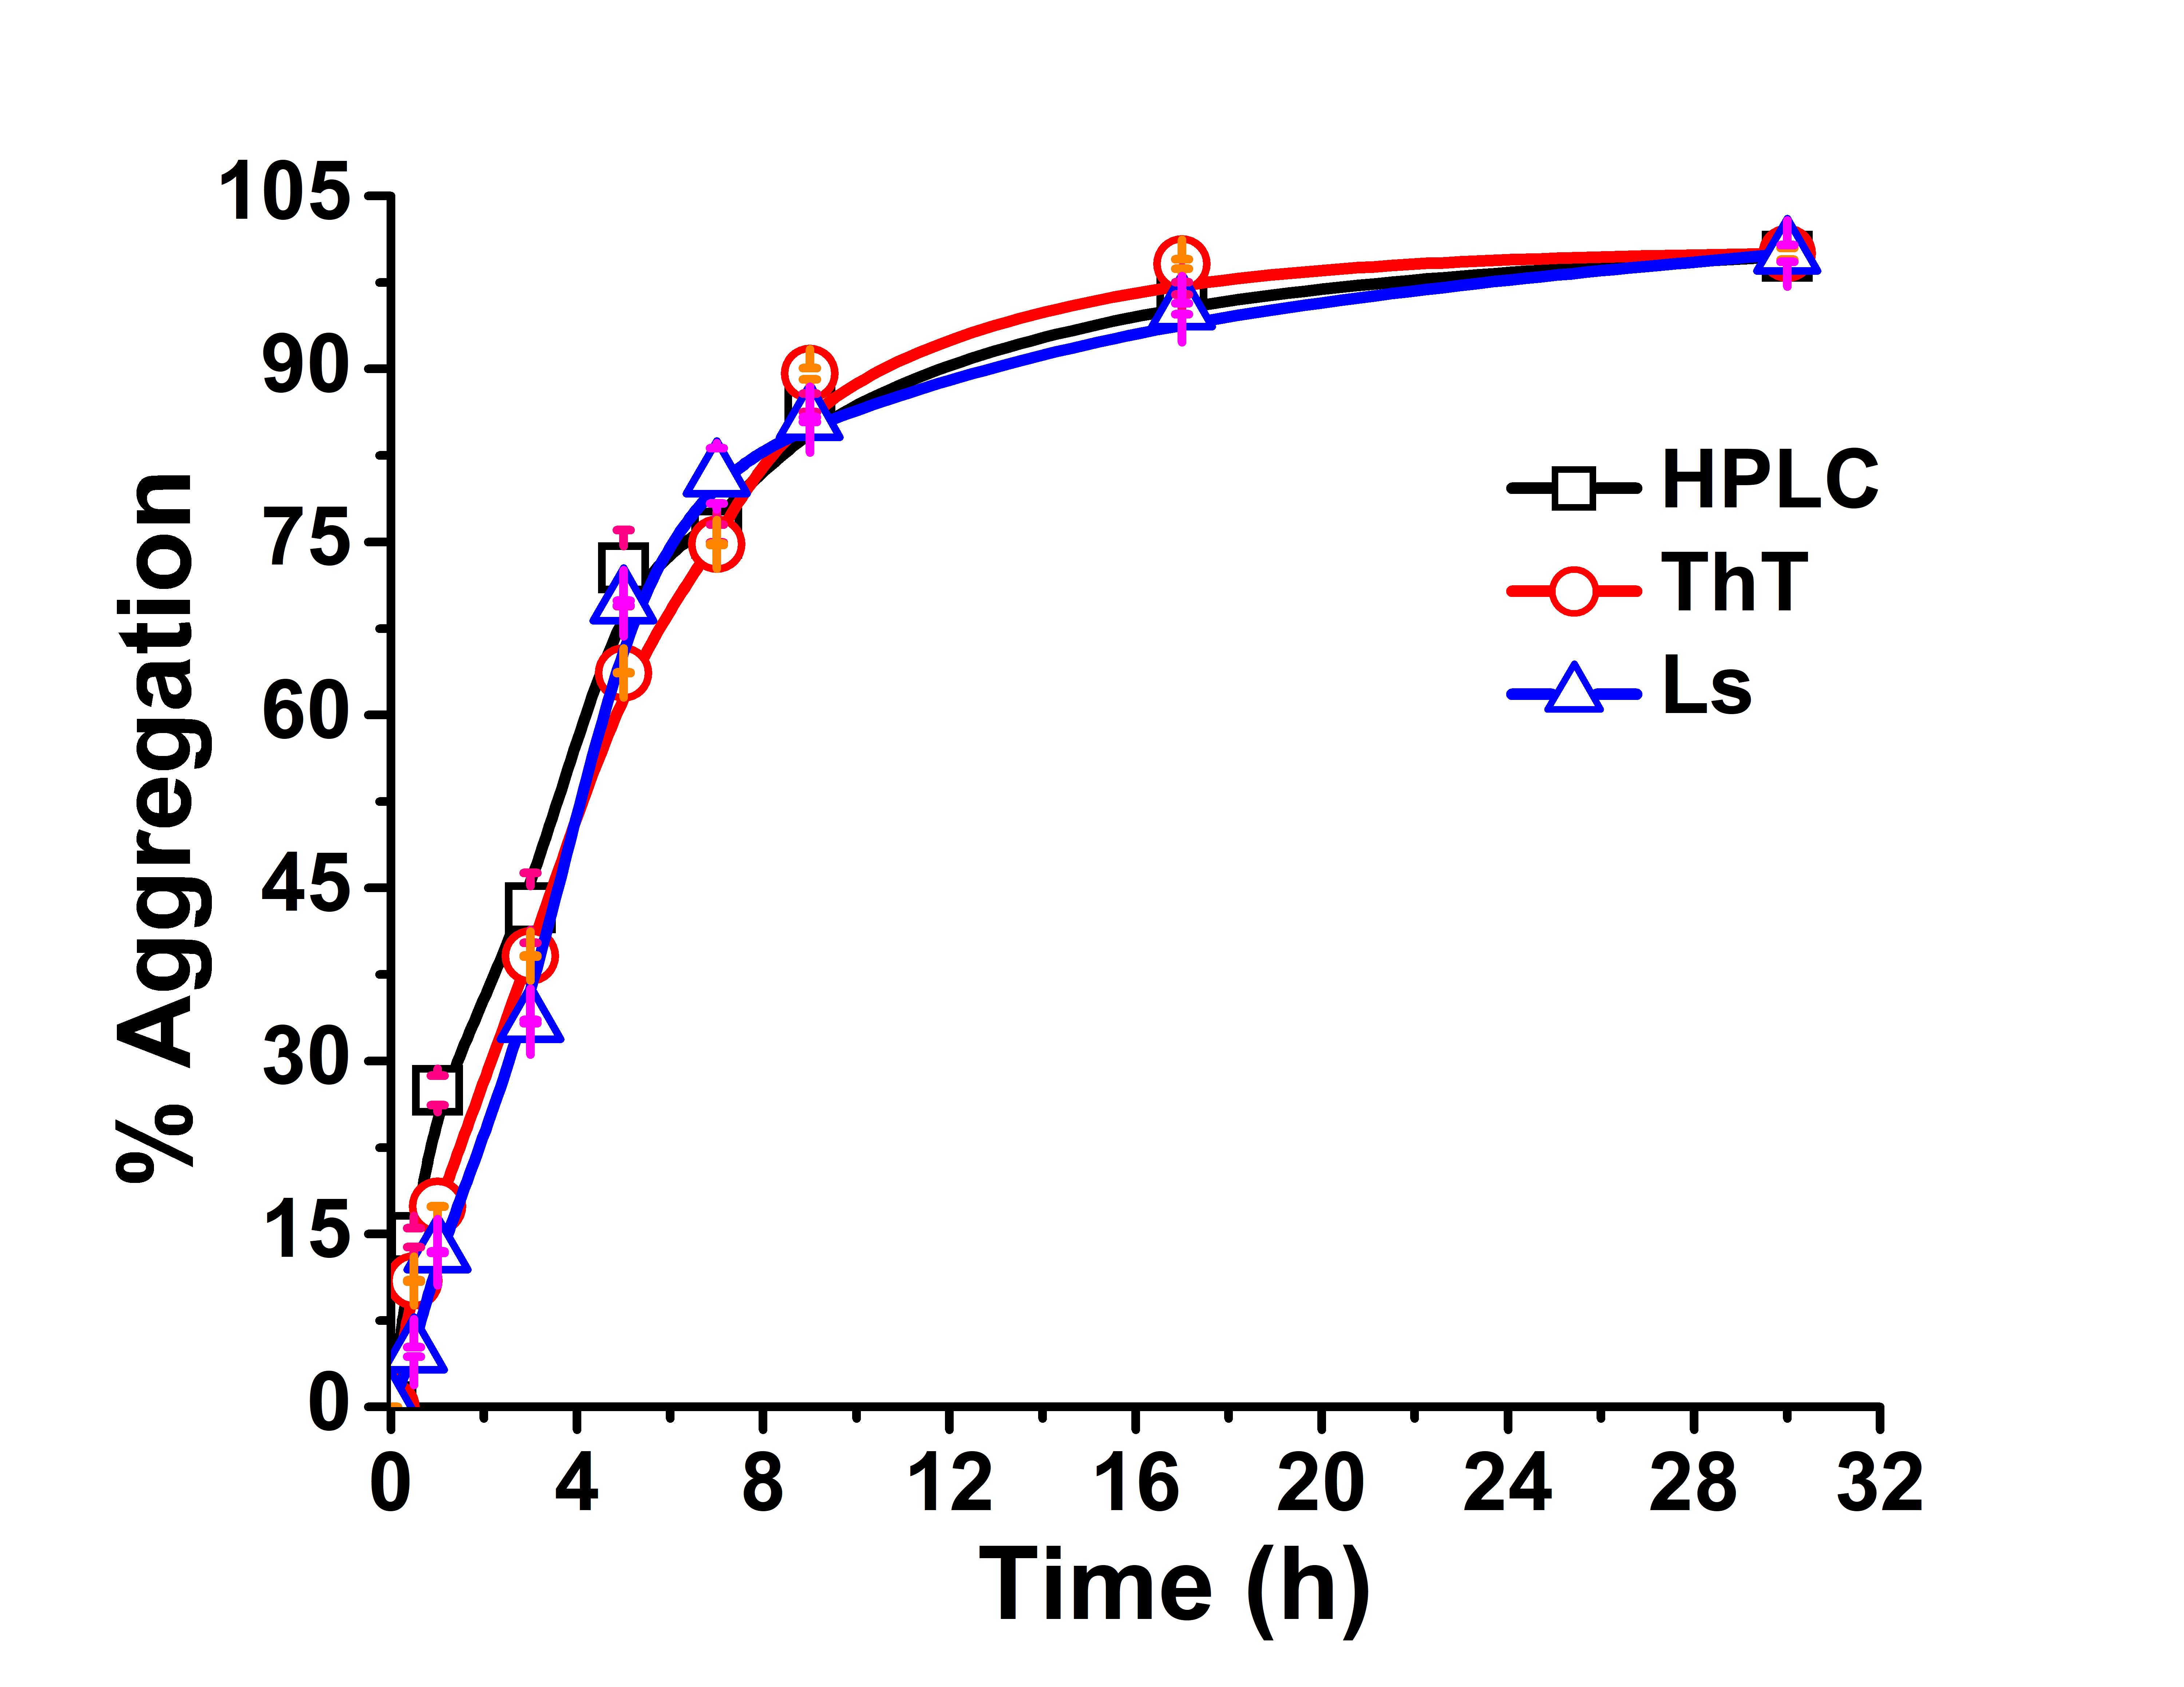
 Figure 1 of
Bawankar, Mol Vis 2025; 31:231-243.
Figure 1 of
Bawankar, Mol Vis 2025; 31:231-243.