Figure 2. Scatterplot of data from Pentacam by principal component analysis. The red circle represents data from the keratoconus group,
the green circle represents data from the control group, and the black triangle represents data from the subclinical parent
group in this study. The dotted circle represents the critical area between the keratoconus group and the control group.
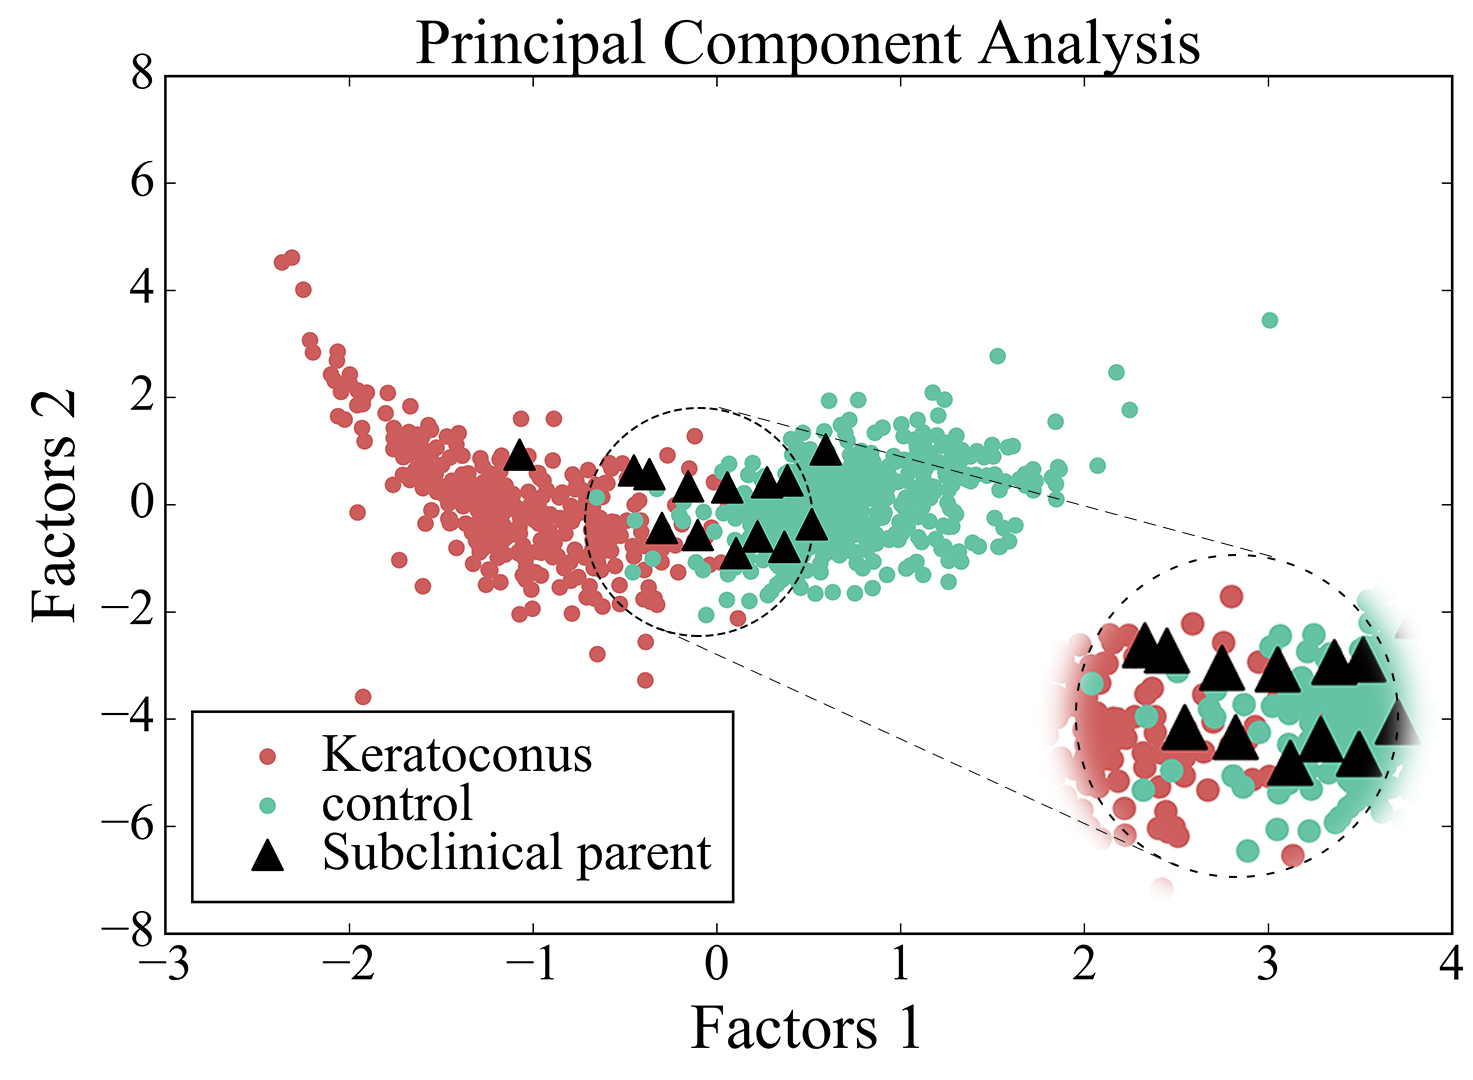
 Figure 2 of
Li, Mol Vis 2025; 31:23-32.
Figure 2 of
Li, Mol Vis 2025; 31:23-32.