Figure 5. Audiograms for affected members of the family. Normal hearing range is highlighted by gray boxes (≤19.9 db HL) and specific
family members denoted in the bottom right corner of the plot. (A) Hearing test in proband III-4. The X symbol is data from the left ear and the circle symbol is data from the right ear.
Blue traces at age 28 and black traces at age 60 show progression of hearing loss over time. PTA scores are denoted in a corresponding
color. (B) Hearing test in son of proband (IV-4). Blue traces at age 16 and black traces at age 22 show progression of hearing loss
over time. (C) Hearing test in brother of proband (III-1). Audiogram traces at age 57 show severe hearing loss (PTA highest of all members
tested). (D) Hearing test in sister of proband (III-6). Audiogram traces at age 51 correspond to lower hearing loss (PTA 45.0) compared
to her two siblings (A and C).
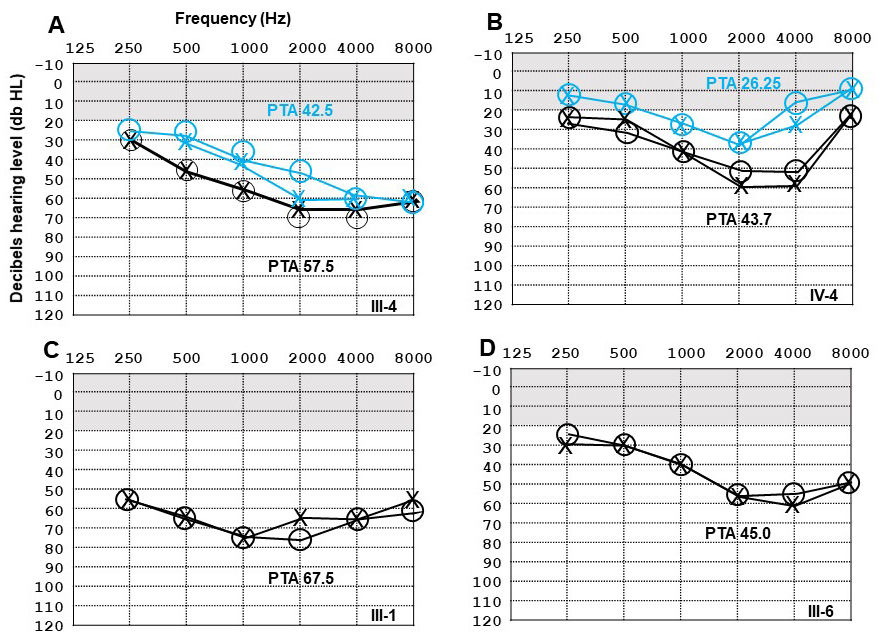
 Figure 5 of
Gregory-Evans, Mol Vis 2025; 31:175-188.
Figure 5 of
Gregory-Evans, Mol Vis 2025; 31:175-188.