Figure 6. The relative mRNA level in each group. Expression levels of vascular endothelial growth factor (A), matrix metalloproteinase 2 (B), matrix metalloproteinase 9 (C) and cyclo-oxygenase 2 (D) mRNA in different groups of human retinal capillary endothelial cells. ns: not significant; **p<0.01, ***p<0.001 compared
with TH group 24 h; #p<0.05, ##p<0.01, ###p<0.001 compared with TH group 48 h; &p<0.05, &&p<0.01, &&&p<0.001 compared with
TH group 72 h. TN group: normal glucose (glucose concentration, 5.5 mmol/l); TH group: high glucose (glucose concentration,
25 mmol/l); T1 group: high glucose + 5 μmol/l ursolic acid (UA); T2 group: high glucose + 10 μmol/l UA; T3 group: high glucose
+ 20 μmol/l UA; T4 group: high glucose + 40 μmol/l UA.
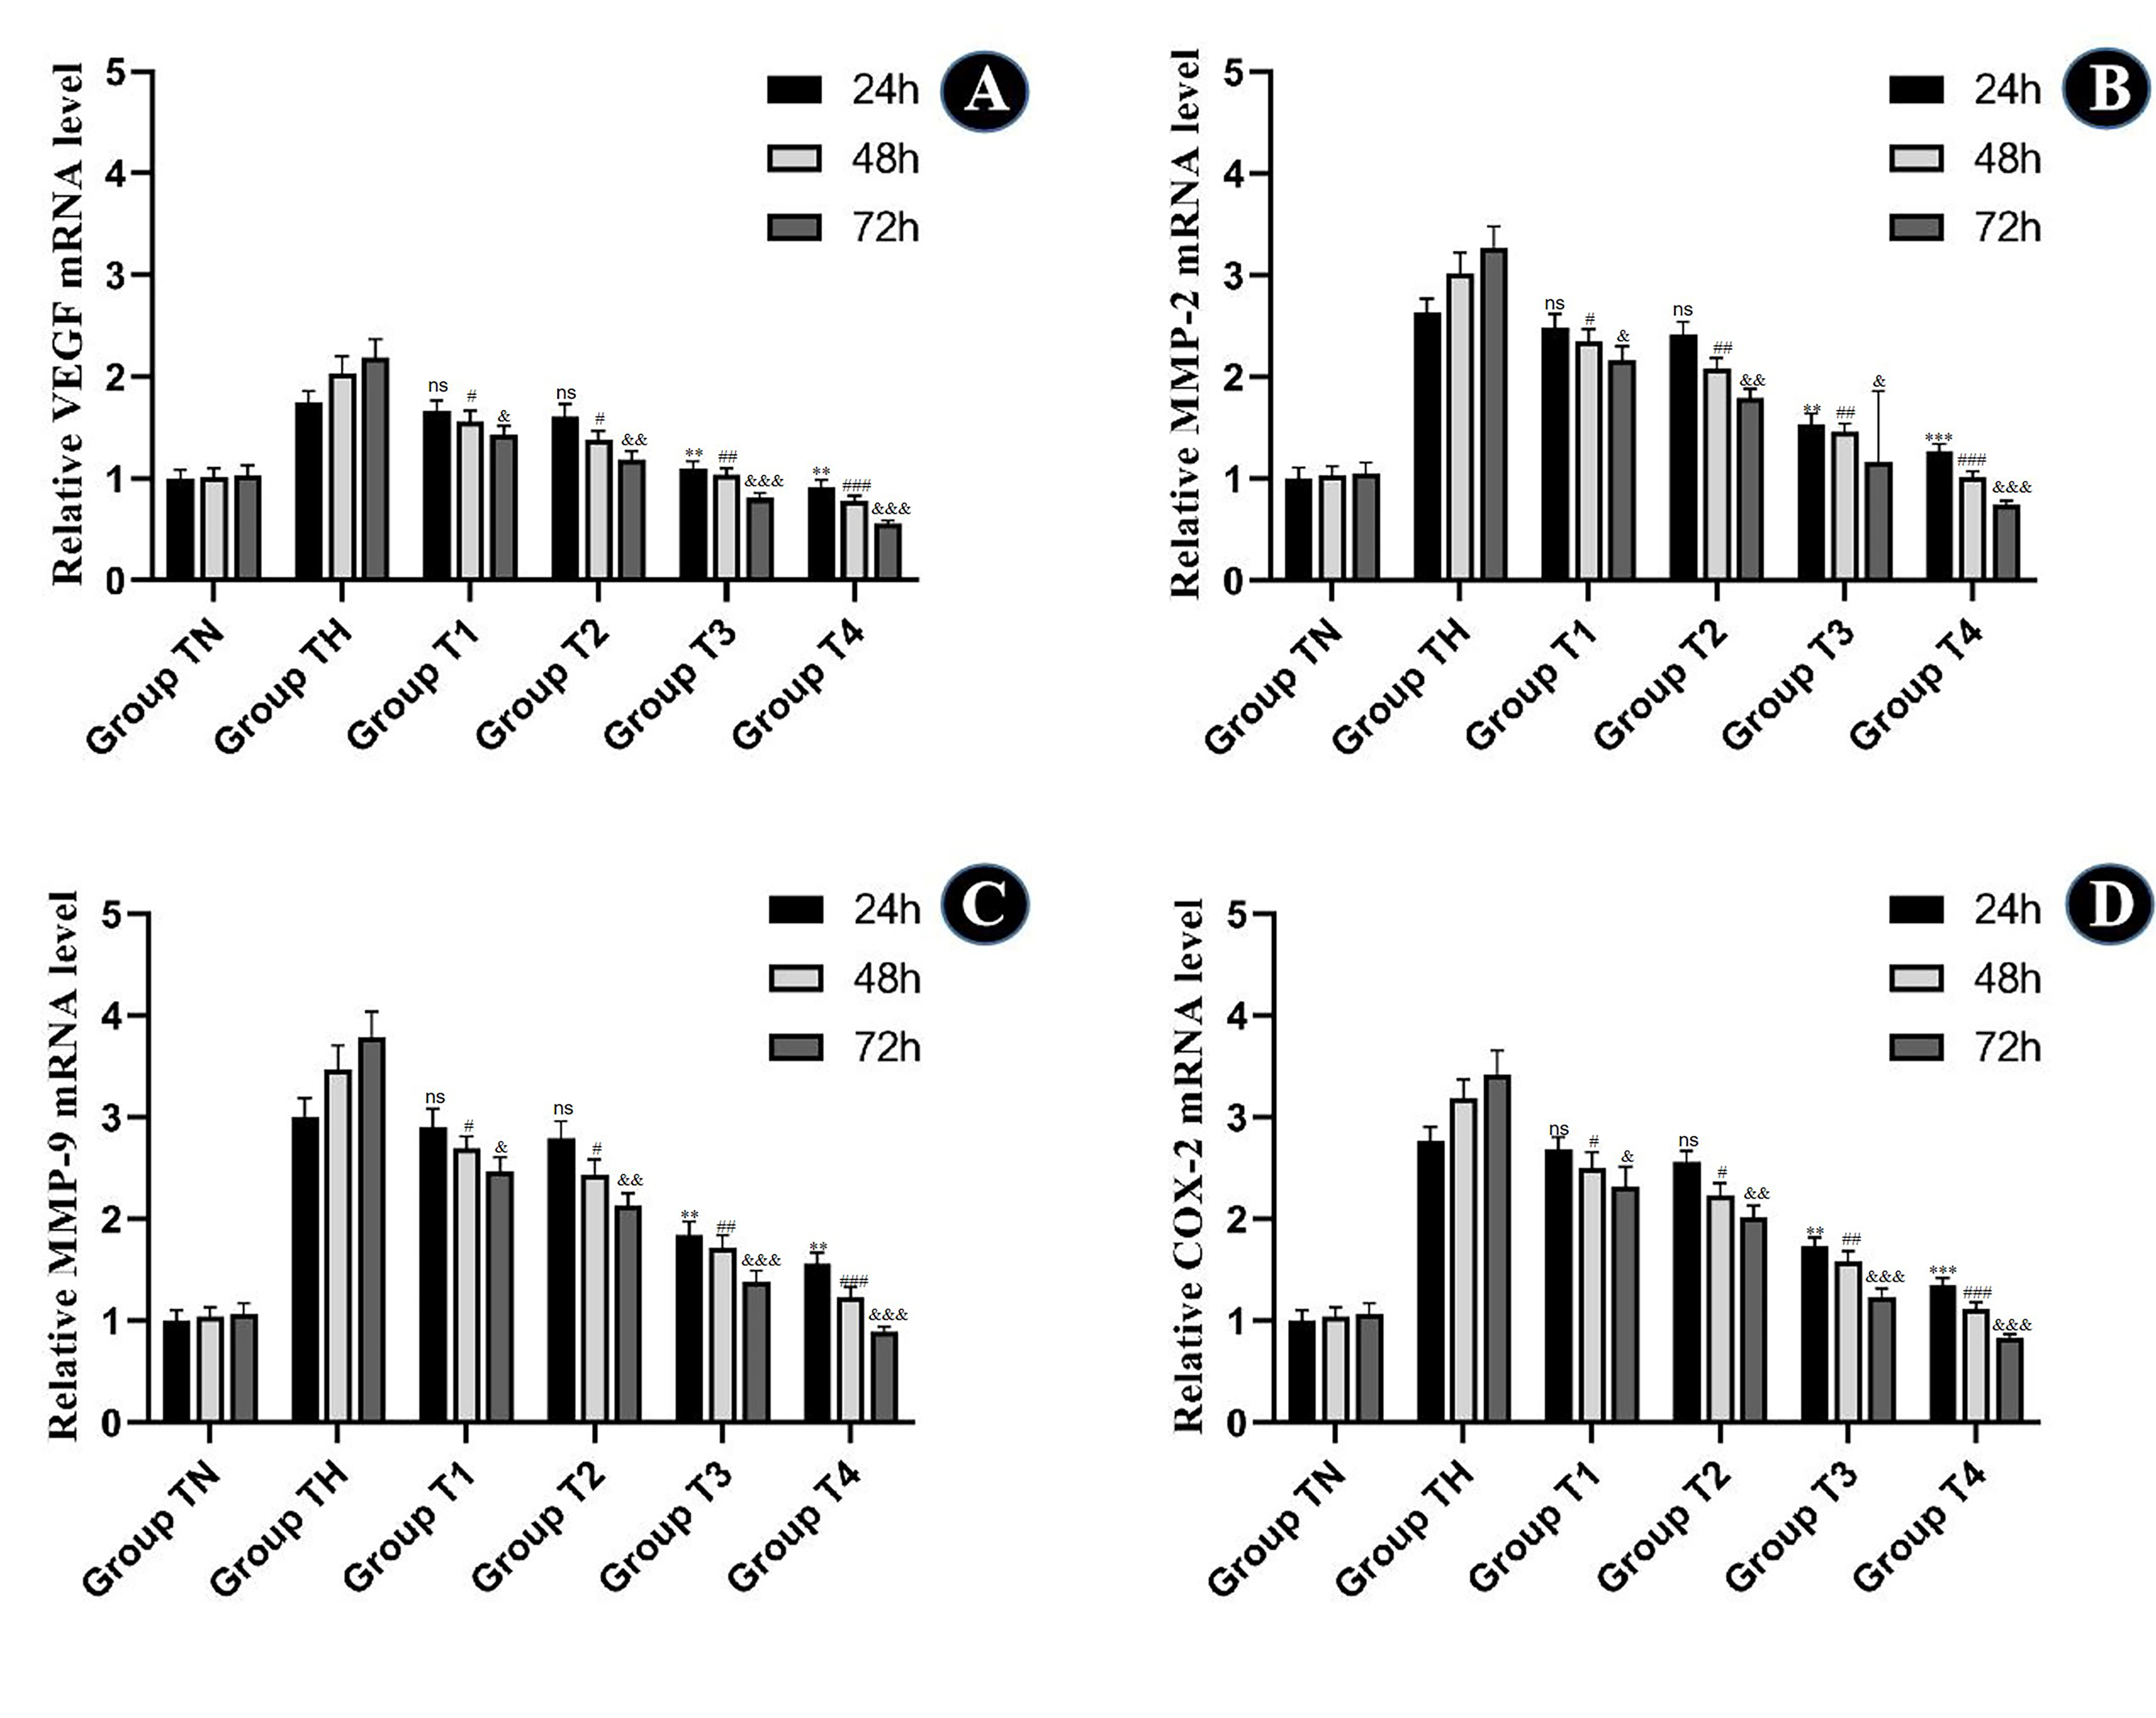
 Figure 6 of
Yang, Mol Vis 2025; 31:160-173.
Figure 6 of
Yang, Mol Vis 2025; 31:160-173.