Figure 4. The mRNA expression of genes in each group. Expression levels of vascular endothelial growth factor (A), matrix metalloproteinase 2 (B), matrix metalloproteinase 99 (C) and cyclo-oxygenase 2 (D) in the retinal tissues of all groups. ns: not significant; **p<0.01 compared with the oxygen-induced retinopathy (OIR)group;
***p<0.001 compared with the OIR group.
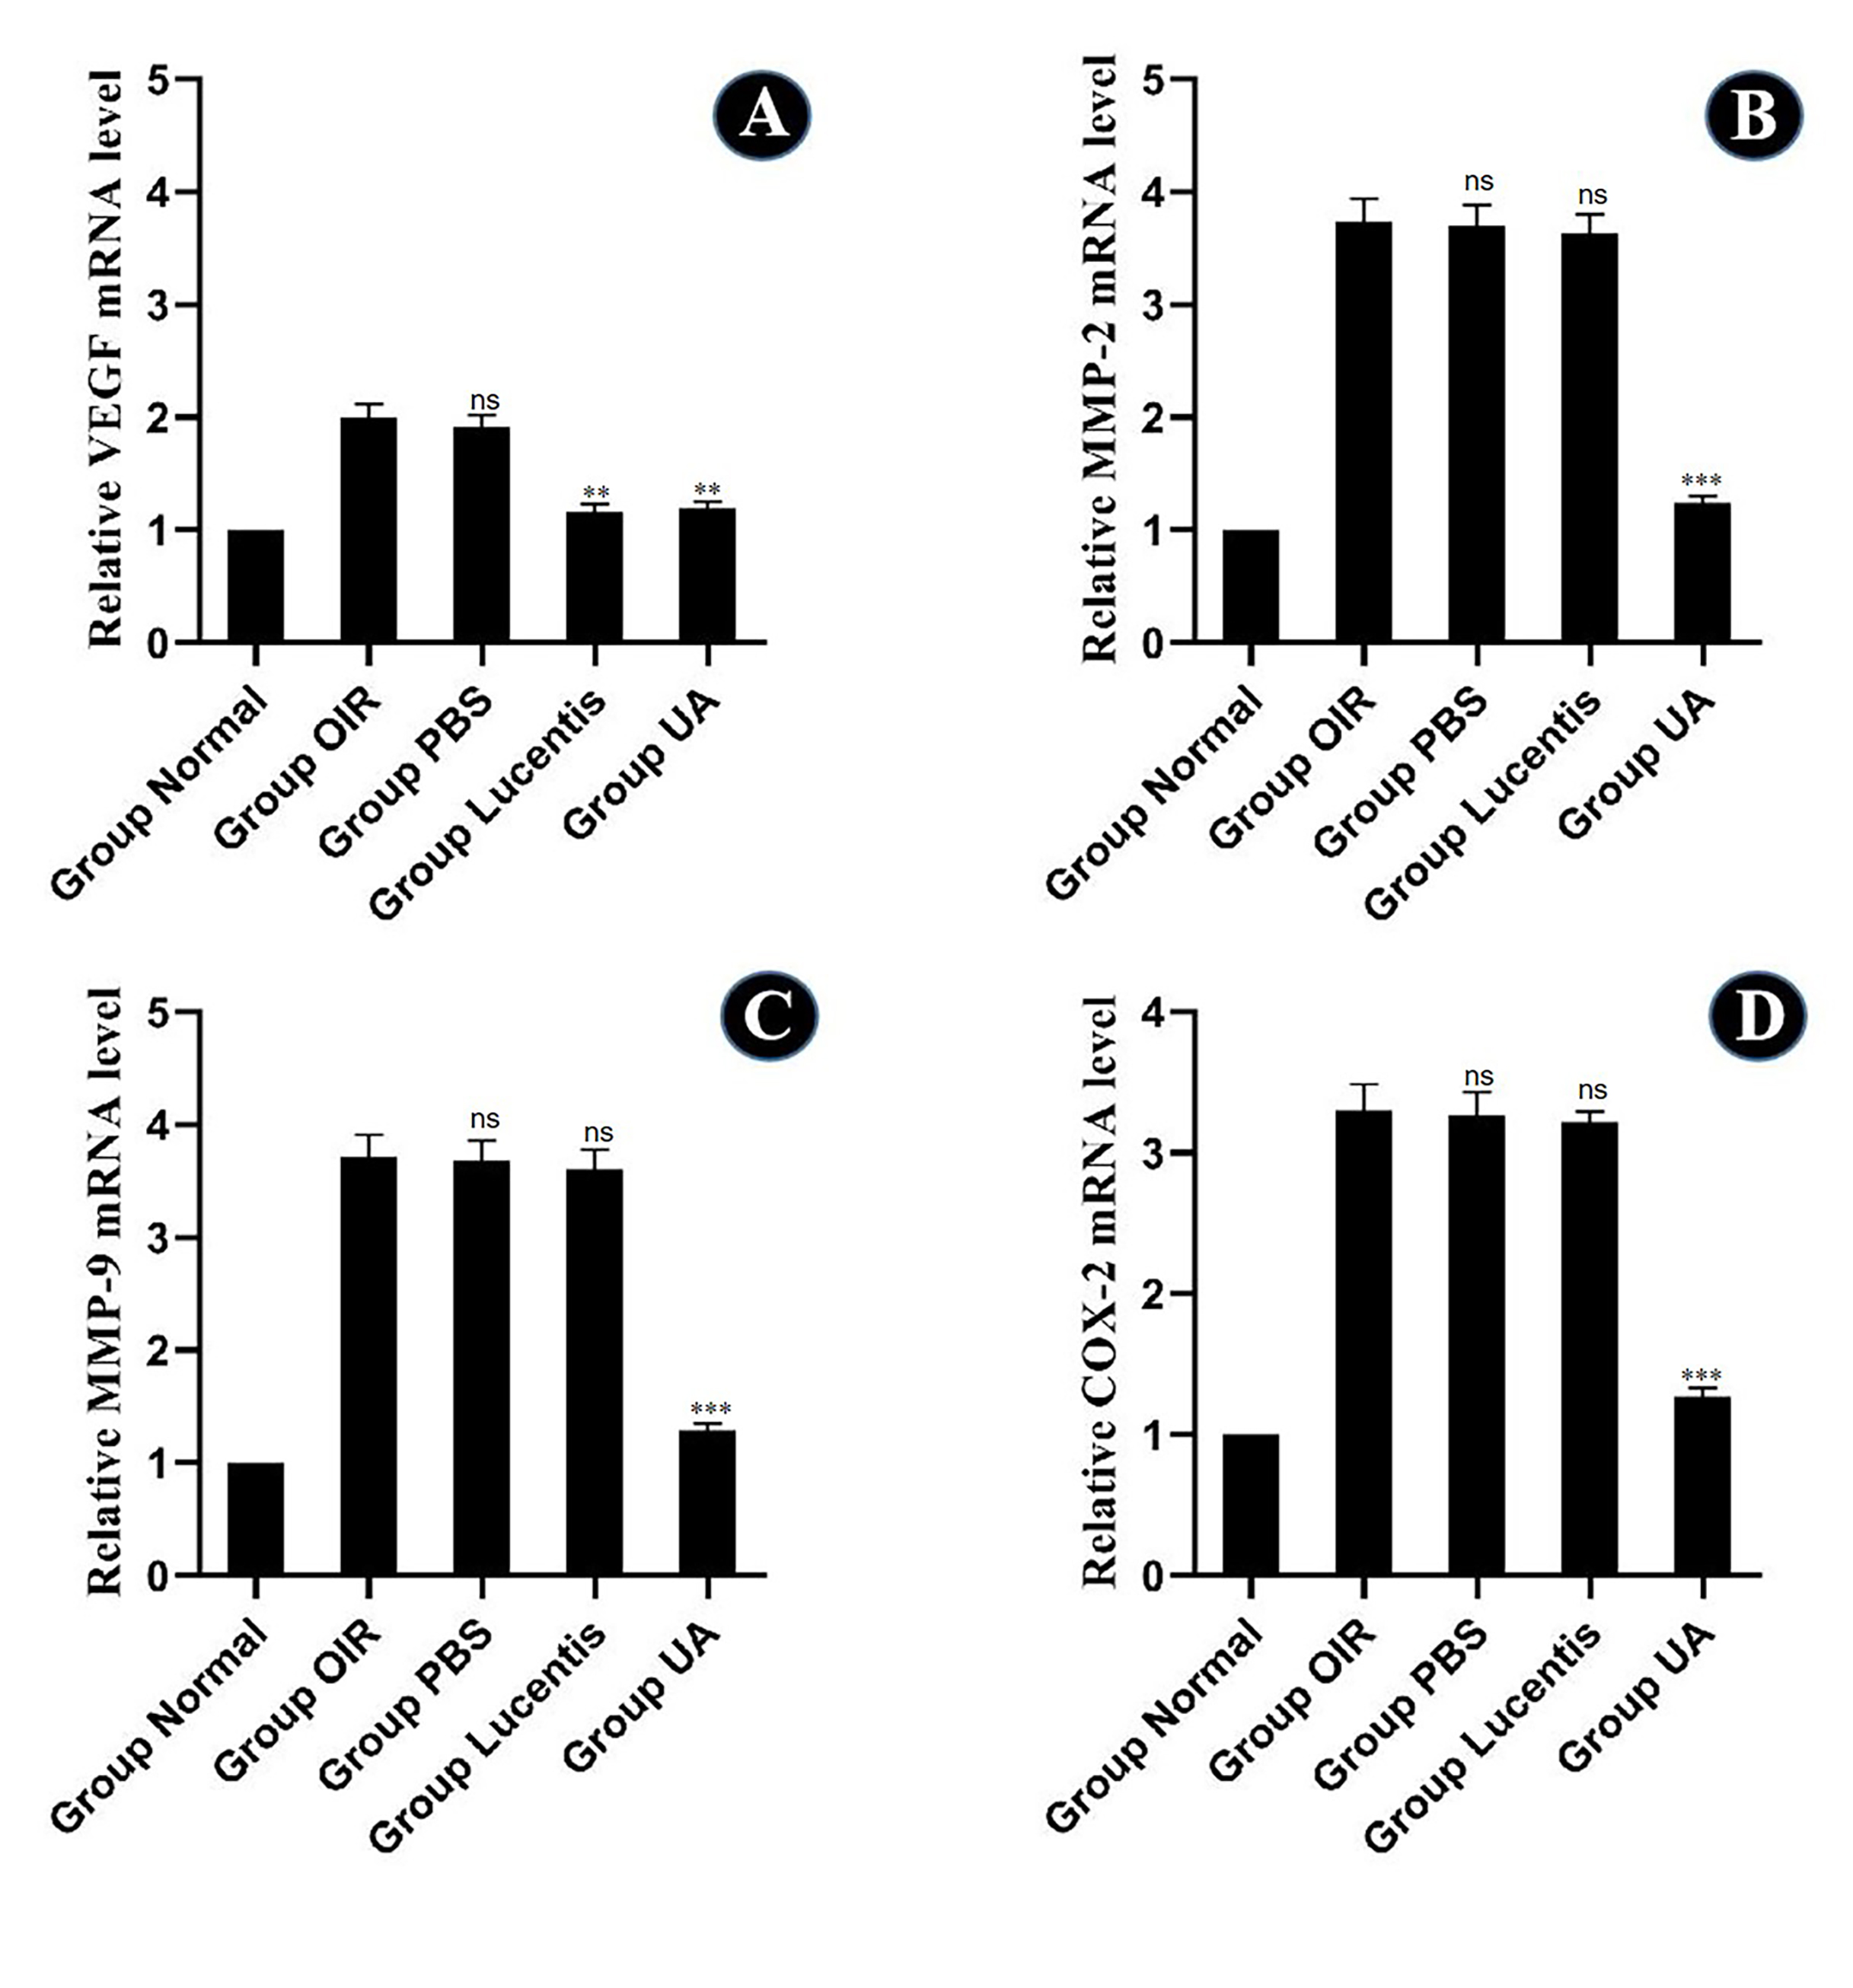
 Figure 4 of
Yang, Mol Vis 2025; 31:160-173.
Figure 4 of
Yang, Mol Vis 2025; 31:160-173.