Figure 14. Corrected fluorescence intensity measurement (CFIM) results of the NTB and control groups. Statistical analysis (Mann–Whitney
U test) indicated that the CFIM level of the NTB group was significantly lower than that of the control group (p = 0.004).
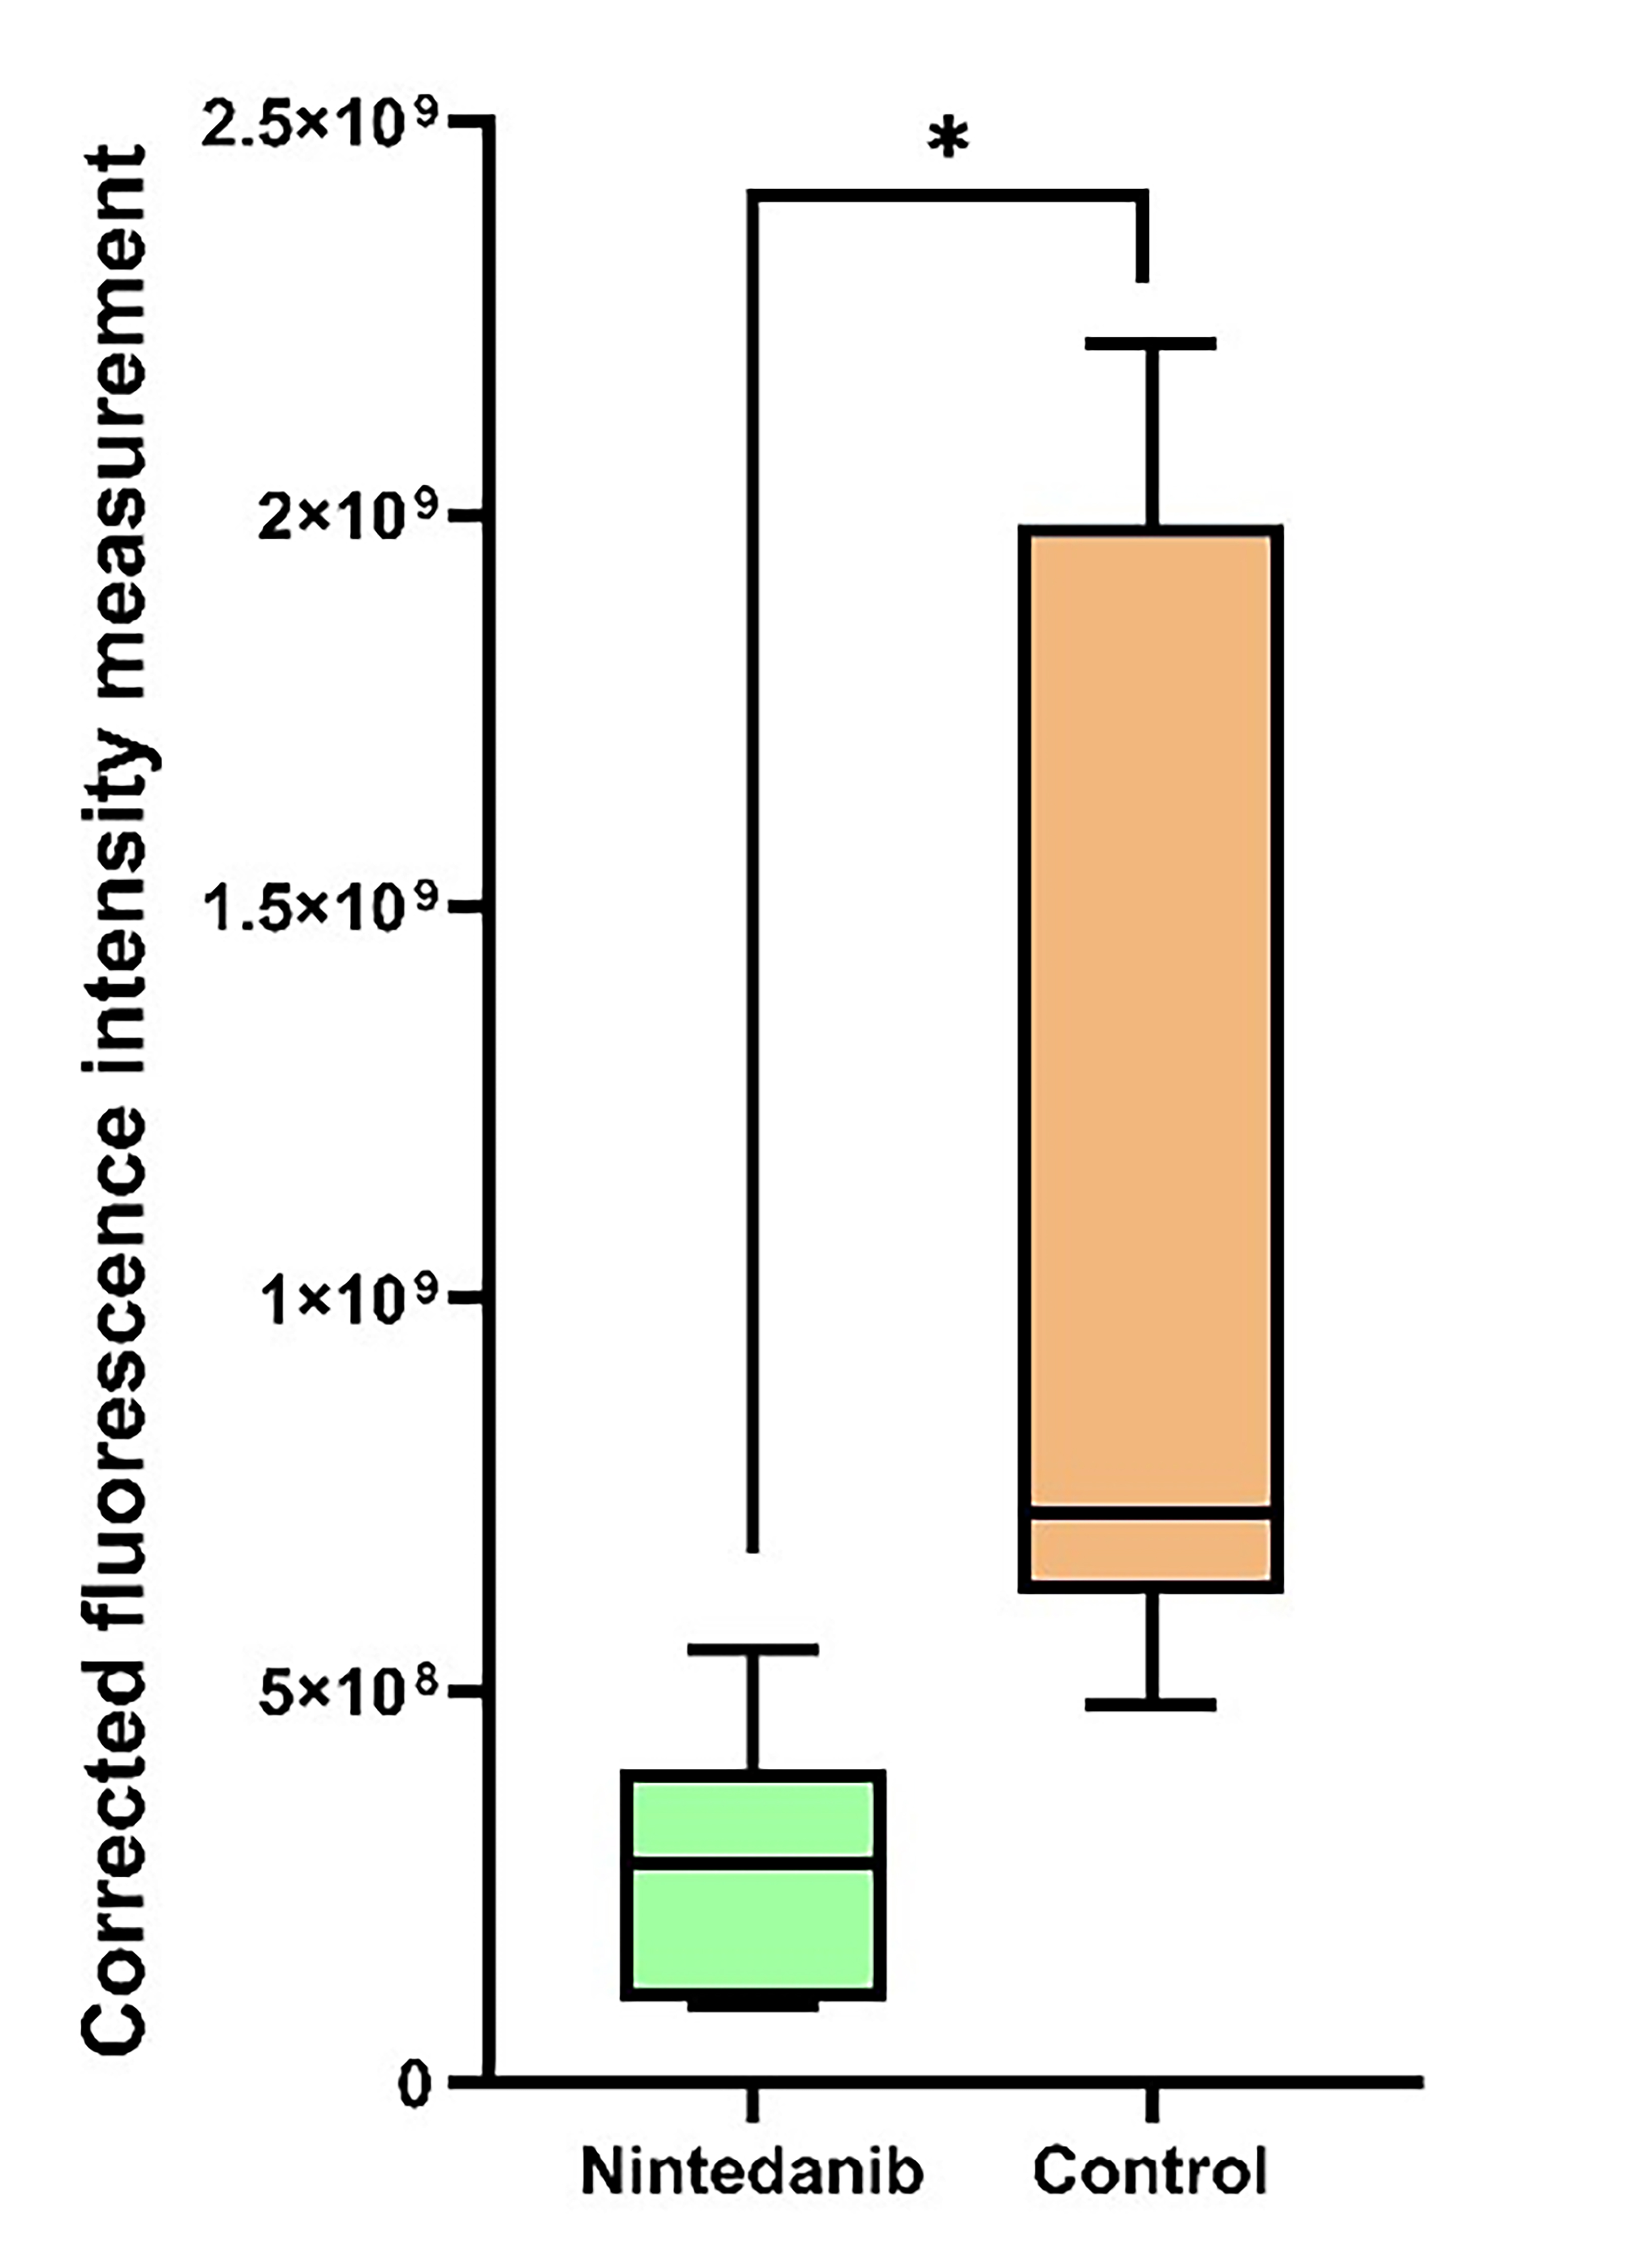
 Figure 14 of
Arslan, Mol Vis 2025; 31:142-157.
Figure 14 of
Arslan, Mol Vis 2025; 31:142-157.