Figure 5. Retinal nerve fiber layer thickness values (μ) on optical coherence tomography in different diabetic retinopathy stages. *Control
versus NoDR, NPDR, and PDR: significant differences, with the control having higher RNFL thickness. NoDR versus NPDR and PDR:
no significant differences. NPDR versus PDR: no significant differences. OCT - optical coherence tomography, RNFL - retinal
nerve fiber layer, NoDR - no diabetic retinopathy, NPDR - non-proliferative diabetic retinopathy, PDR - proliferative diabetic
retinopathy.
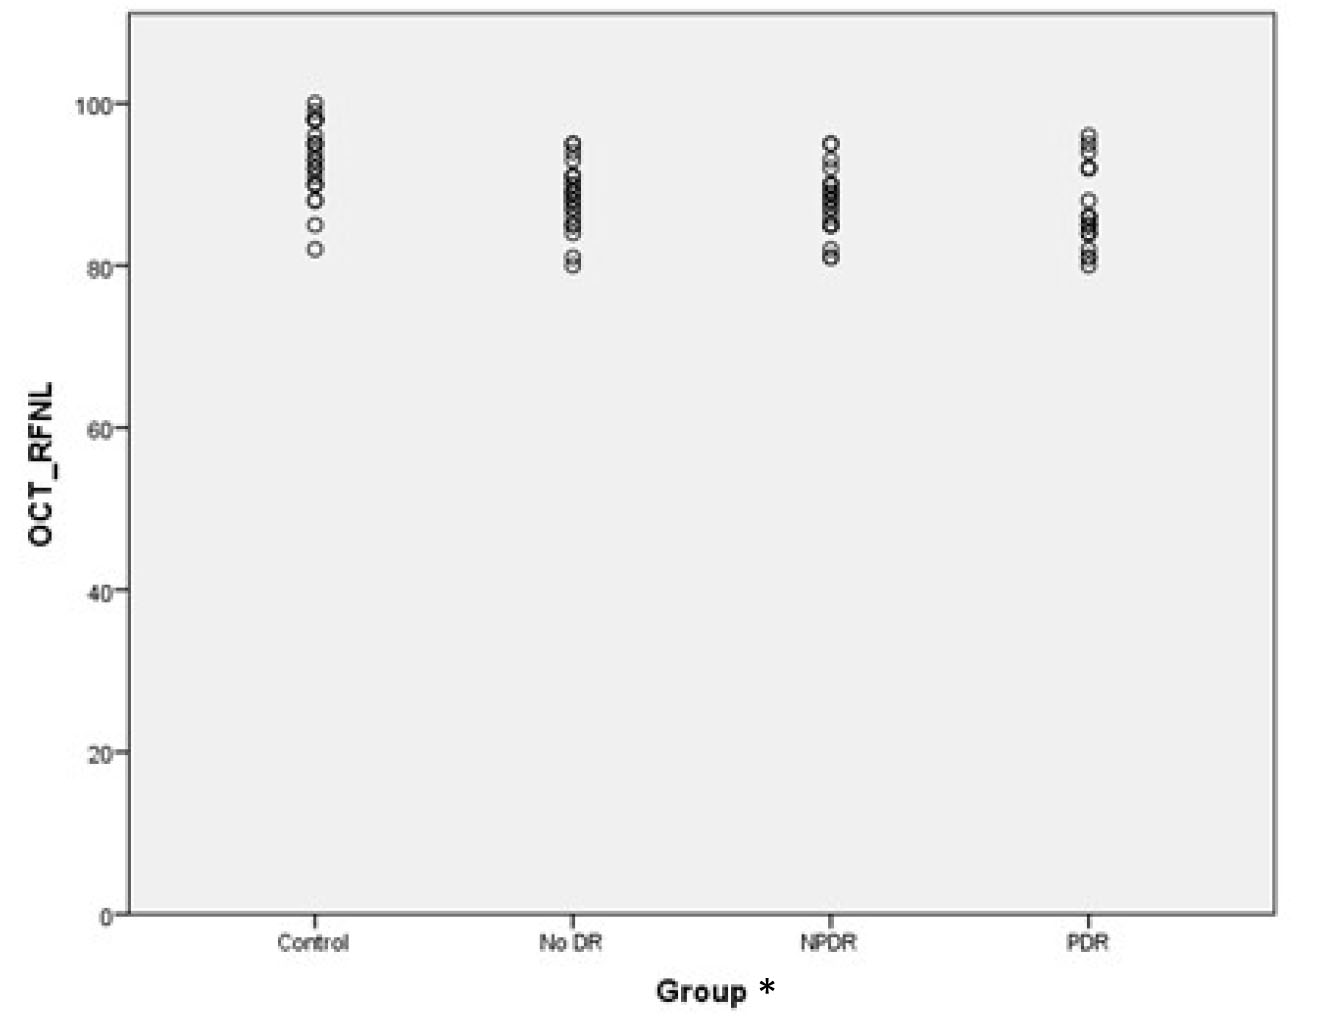
 Figure 5 of
Chaturvedi, Mol Vis 2025; 31:10-21.
Figure 5 of
Chaturvedi, Mol Vis 2025; 31:10-21.