Figure 2. Foveal avascular zone values (%) on optical coherence tomography angiography in different diabetic retinopathy stages. *Control
versus NPDR and PDR: significant differences, with the control having lower FAZ values. NoDR versus NPDR and PDR: significant
differences, with NoDR having lower FAZ values. NPDR versus PDR: significant difference, with NPDR having lower FAZ values.
OCTA - optical coherence tomography angiography, FAZ - foveal avascular zone, NoDR - no diabetic retinopathy, NPDR - non-proliferative
diabetic retinopathy, PDR - proliferative diabetic retinopathy.
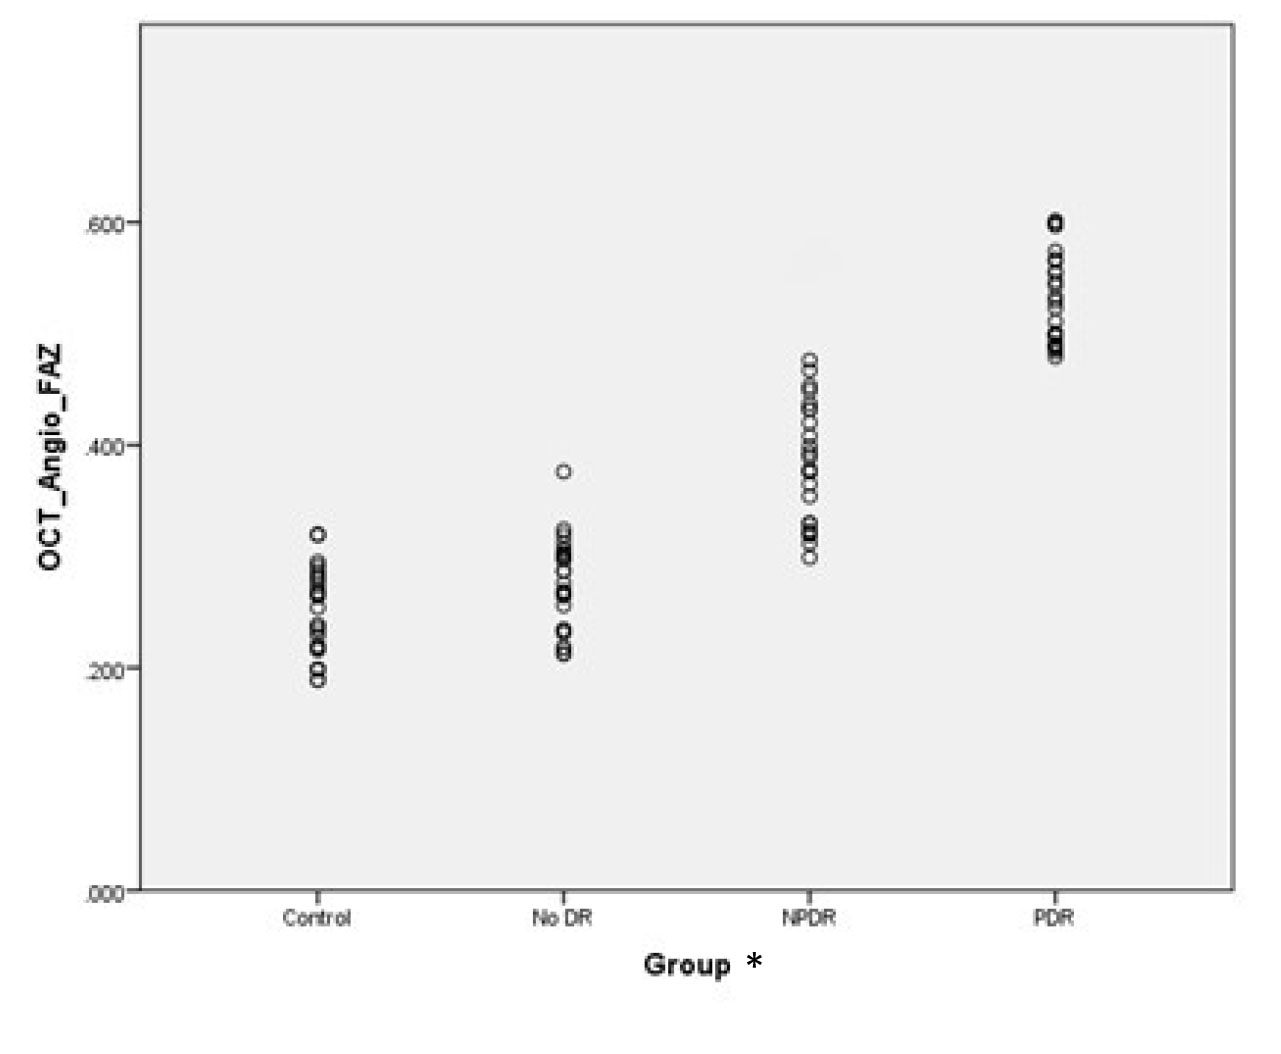
 Figure 2 of
Chaturvedi, Mol Vis 2025; 31:10-21.
Figure 2 of
Chaturvedi, Mol Vis 2025; 31:10-21.