Figure 3. Four groups. Four groups (NC=control, BL=blue light exposure, WL=white light exposure, YL=yellow light exposure) and their
corresponding number of apical and basal dendritic branching points, as well as apical and basal dendritic intersections at
different distances from the cell soma. The error bar indicates the standard error of the mean. The p value for the interaction
between group and distance (In) and the difference across the groups were derived from a two-way ANOVA.
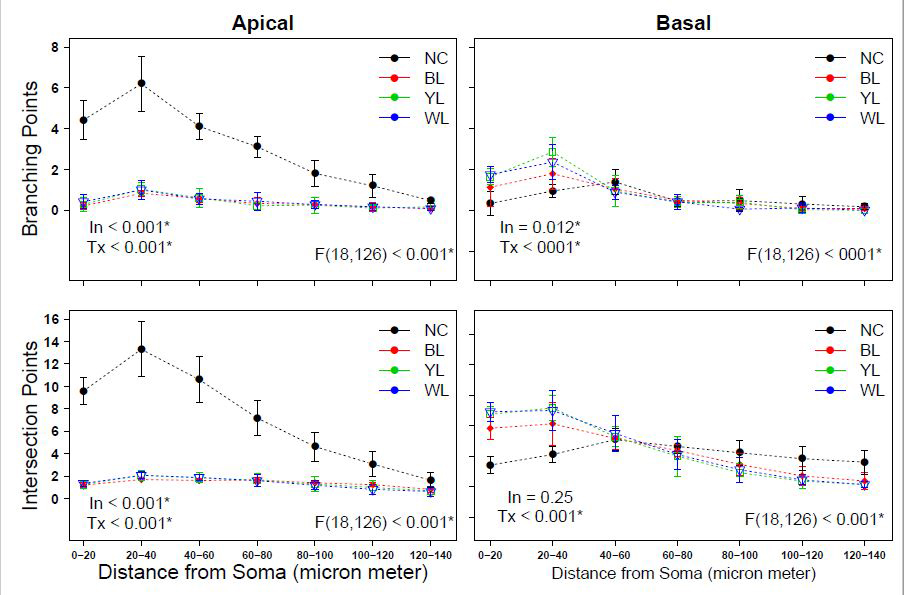
 Figure 3 of
Theruveethi, Mol Vis 2024; 30:67-73.
Figure 3 of
Theruveethi, Mol Vis 2024; 30:67-73.