Figure 5. Comparison of viable epithelial cell density between treated and control groups in the diffused apoptosis model. A: On the left is the comparison of viable cell density in cells per mm2 between the control and treated lenses of each pair of eyes. On the right is the overall comparison (box plot; p = 0.002).
B: Representative viability image analyzed by the CorneaJ plugin of the Fiji software in the 8-mm region of interest. On the
left is the treated lens with the lowest vECD (viability = 95.5% and vECD =2,918 cells/mm2), and its untreated control lens is on the right (viability = 99.9% and vECD = 3,535 cells/mm2).
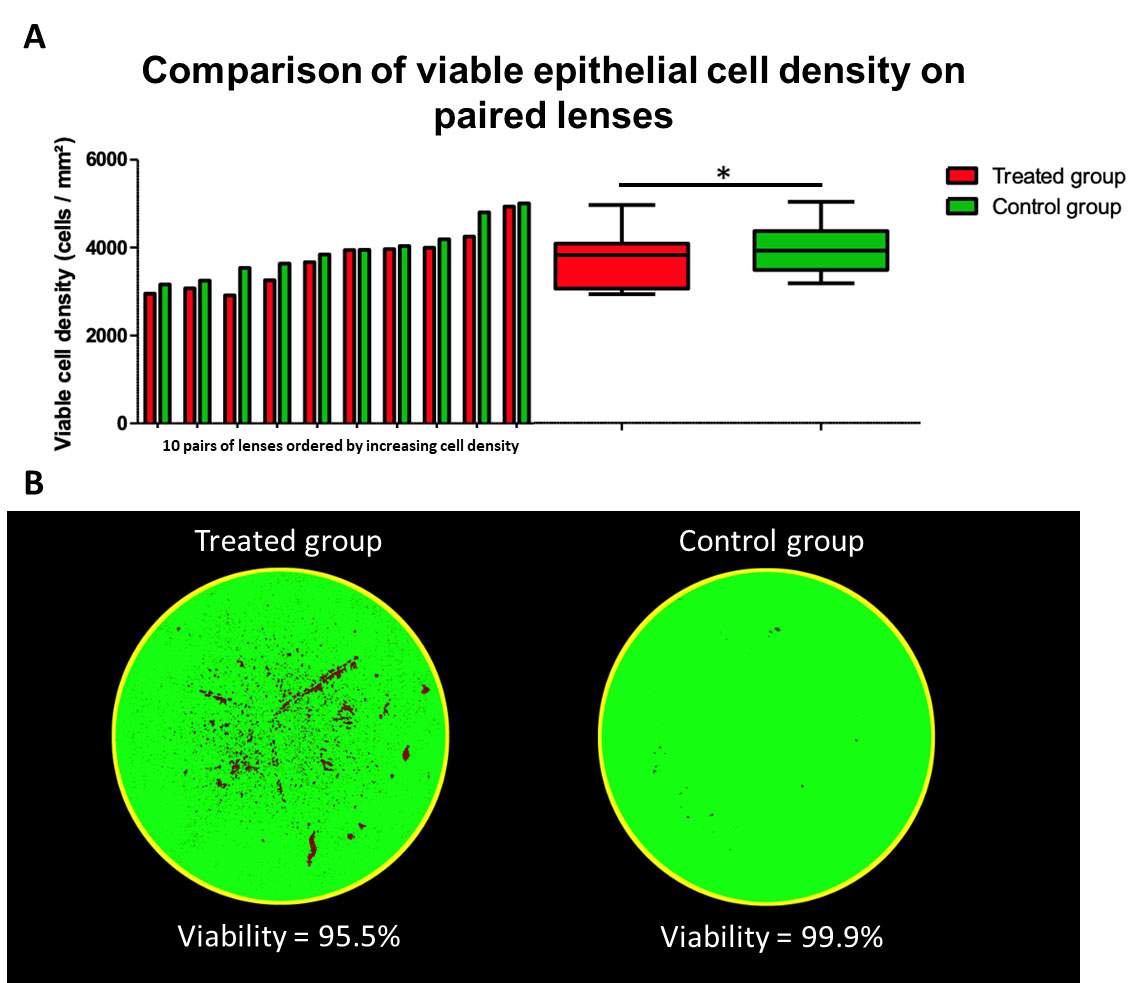
 Figure 5 of
Poinard, Mol Vis 2024; 30:478-487.
Figure 5 of
Poinard, Mol Vis 2024; 30:478-487.