Figure 4. Comparison of viable epithelial cell density between treated and control groups in the localized necrosis model. A: On the left is the comparison of viable cell density in cells per mm2 between the control and treated lenses of each pair of eyes. The lenses were ranked in increasing order of vECD. On the right
is the overall comparison (box plot representing the median [central line], the interquartile range [box], and the extreme
values [whiskers; p = 0.002]). B: Representative viability image analyzed by the CorneaJ plugin of Fiji software in the 8-mm
region of interest. On the left is the treated lens (viability = 82% and vECD = 2,760 cells/mm2); on the right is its untreated control lens (viability = 100% and vECD = 2,947 cells/mm2).
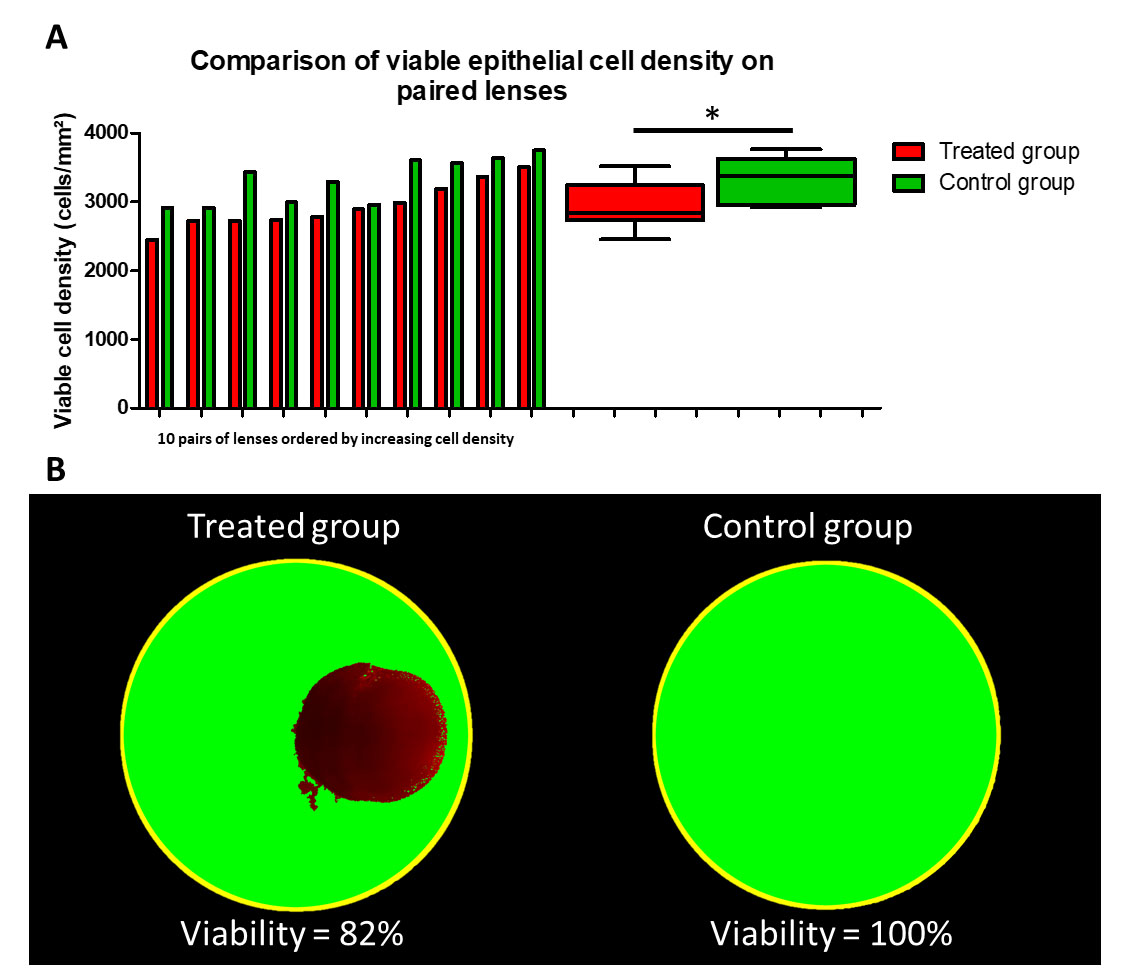
 Figure 4 of
Poinard, Mol Vis 2024; 30:478-487.
Figure 4 of
Poinard, Mol Vis 2024; 30:478-487.