Figure 3. Correlation between the two lenses of the same animal of cell density measured outside the cryo-applied zone to validate the
reproducibility of the cell count. The red line corresponds to the linear regression, and the gray dotted line represents
the bisector of an ideal correlation. The equation of the regression line is Y = 0.9922X + 53.60. The R (Spearman) is 0.9336,
and the p value is < 0.0001.
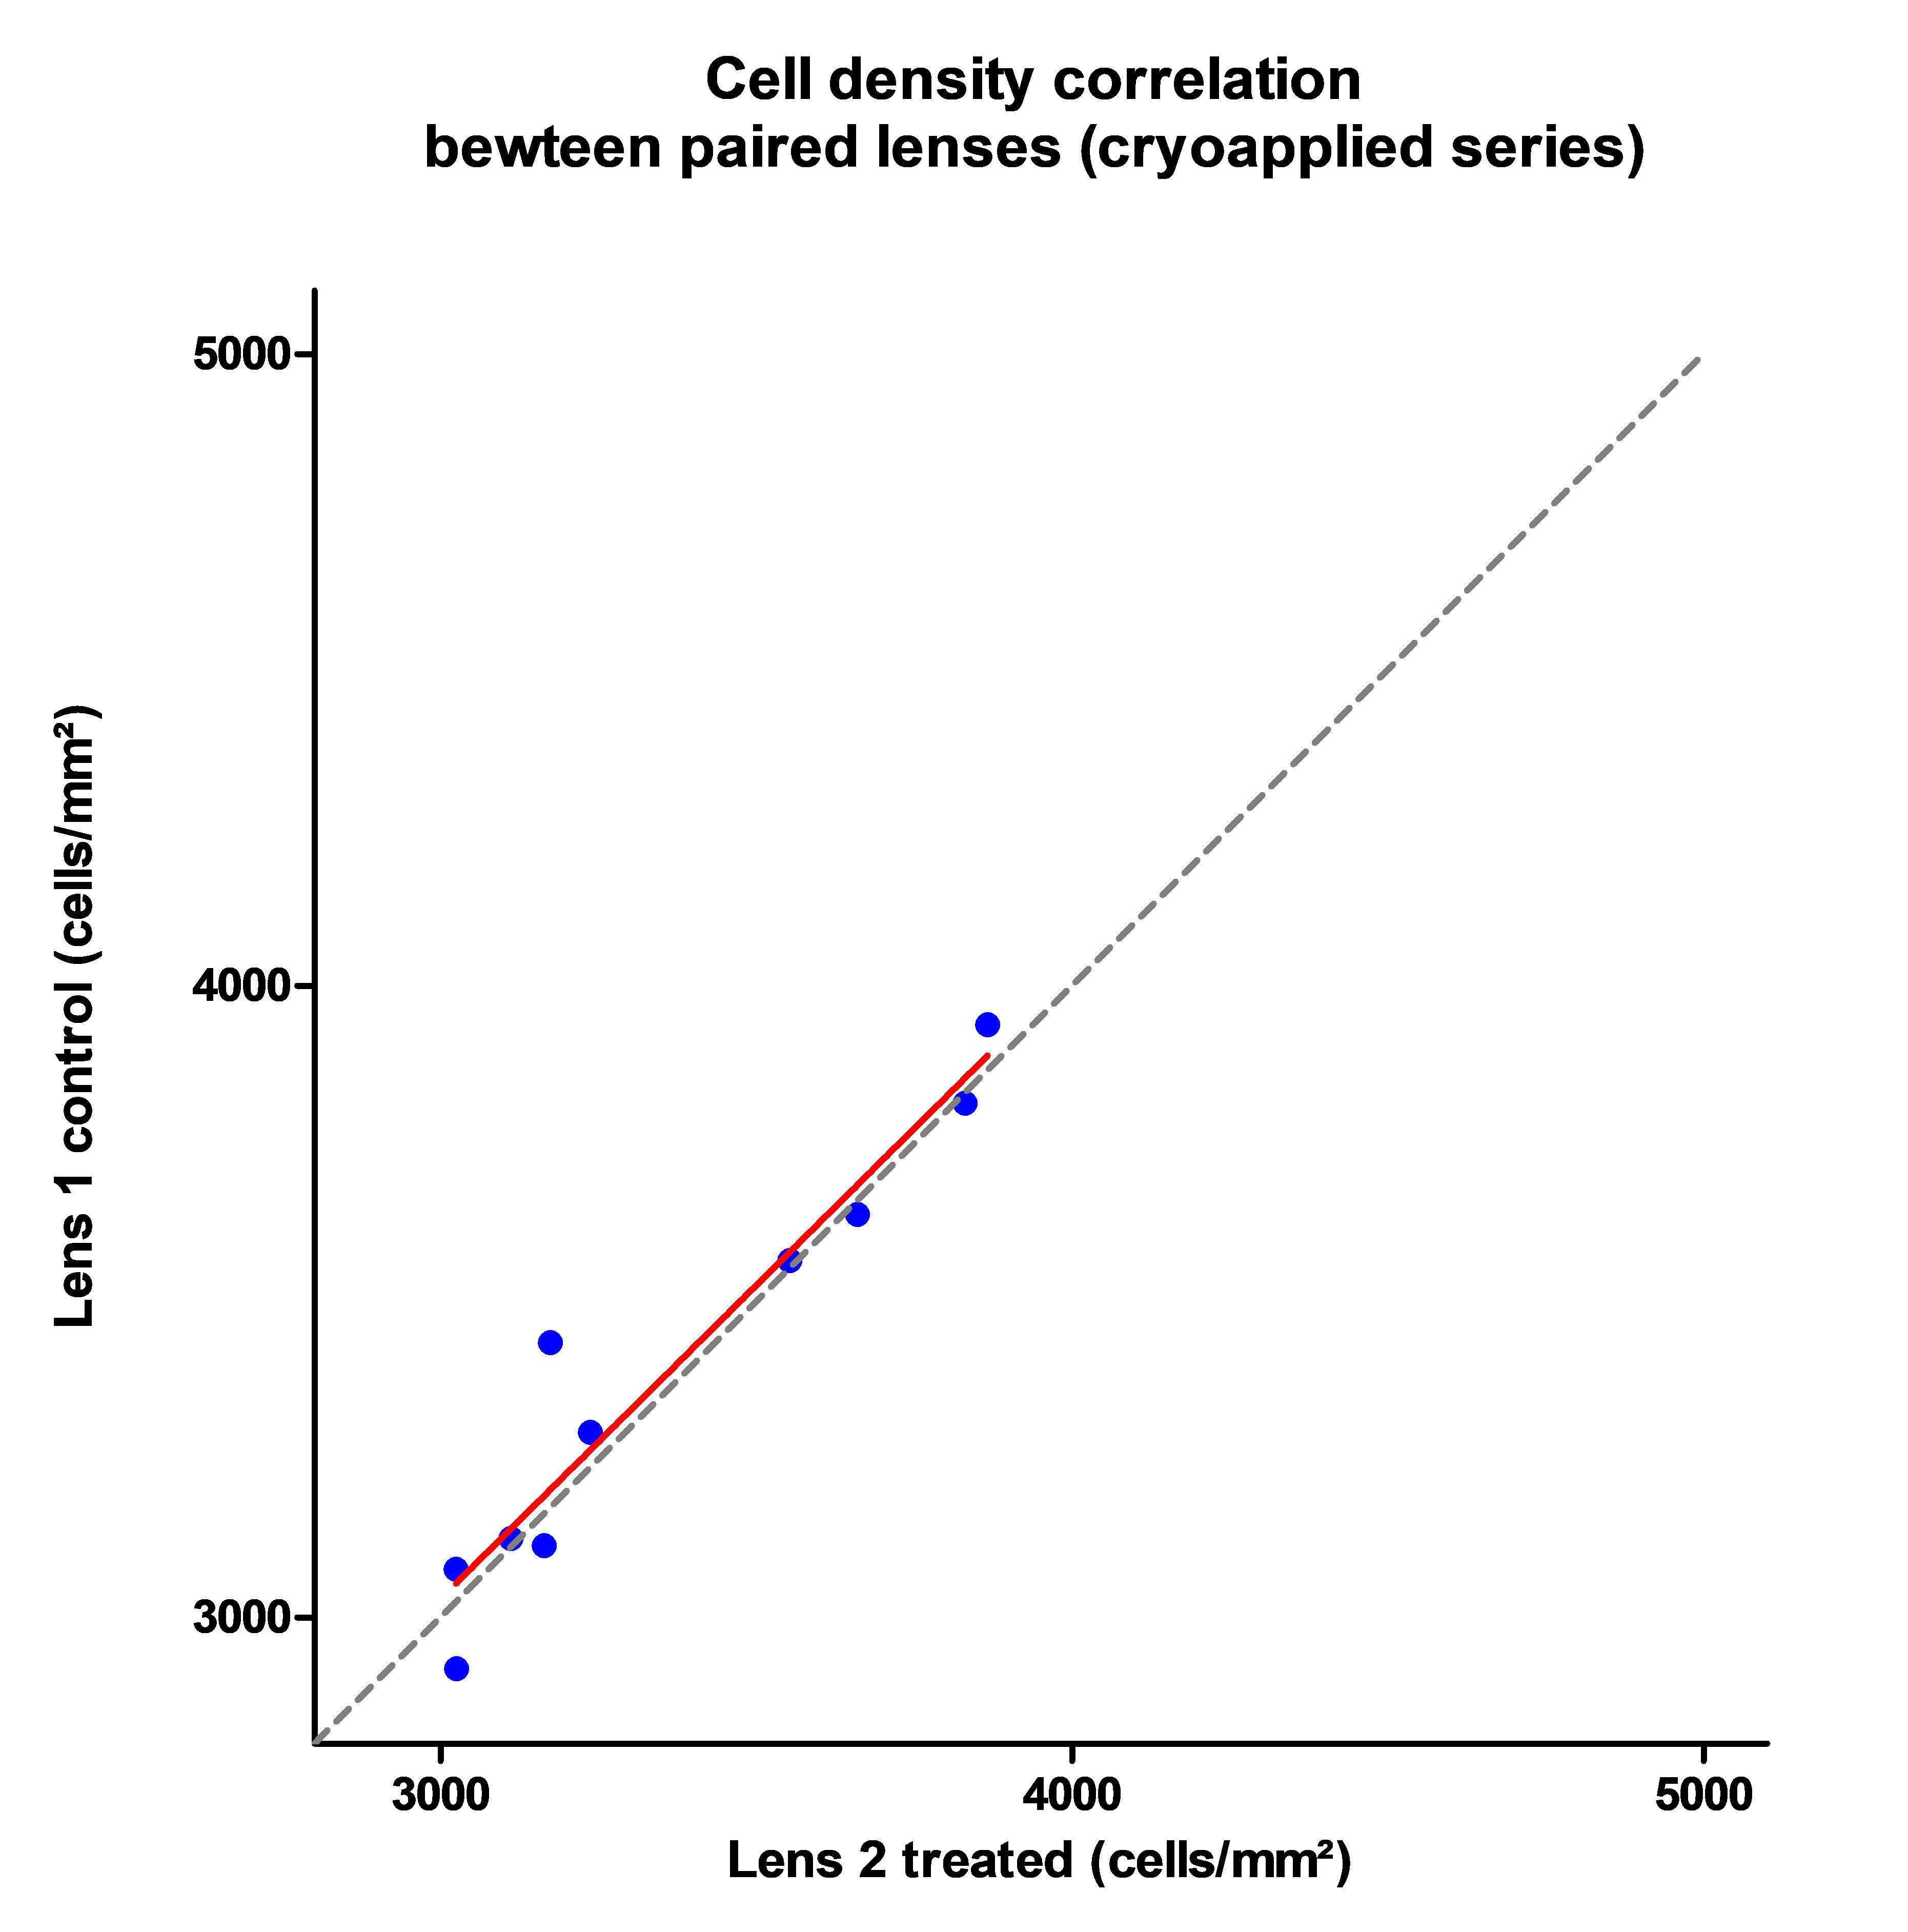
 Figure 3 of
Poinard, Mol Vis 2024; 30:478-487.
Figure 3 of
Poinard, Mol Vis 2024; 30:478-487.