Figure 2. Complementarity of the viability marker (calcein, green fluorescence) and the mortality marker (ethidium, red fluorescence).
The yellow circle shows the 8-mm diameter region of interest (ROI) used to standardize the viability calculation. The percentage
indicates the viable and dead areas in this ROI. Notably, at this low magnification (required to image the entire lens), ethidium
highlighted isolated cells that did not appear negative with highly intense calcein staining. Thus, the discrimination of
ethidium was superior at the cellular level under these observation conditions.
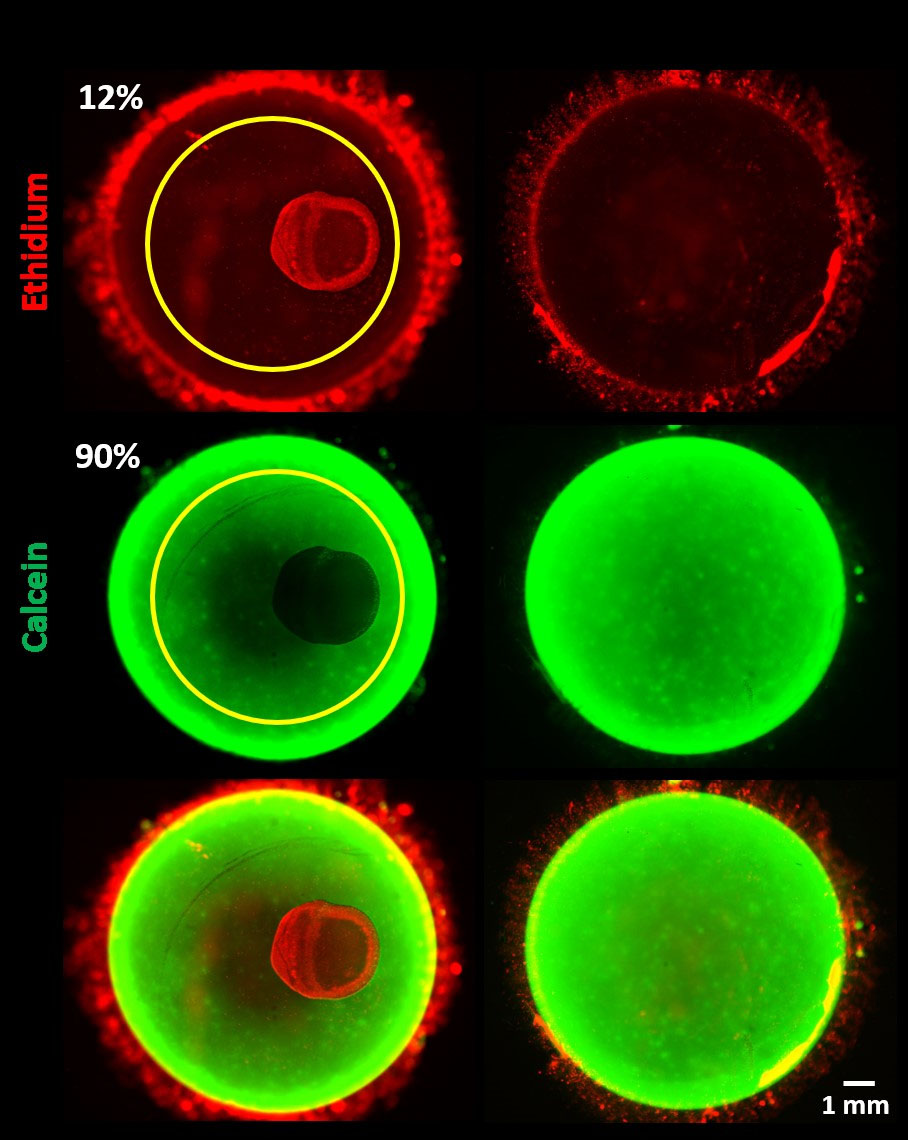
 Figure 2 of
Poinard, Mol Vis 2024; 30:478-487.
Figure 2 of
Poinard, Mol Vis 2024; 30:478-487.