Figure 3. Corneal epithelial wound healing in PPARα−/− mice. Representative slit-lamp images (A) and wound closure analysis (B) show the fluorescein staining area in WT mice compared to PPARα−/− mice at different time points (0/12/24/36/48 h). Data are shown as mean ± SD n=6–8, ***p<0.001.
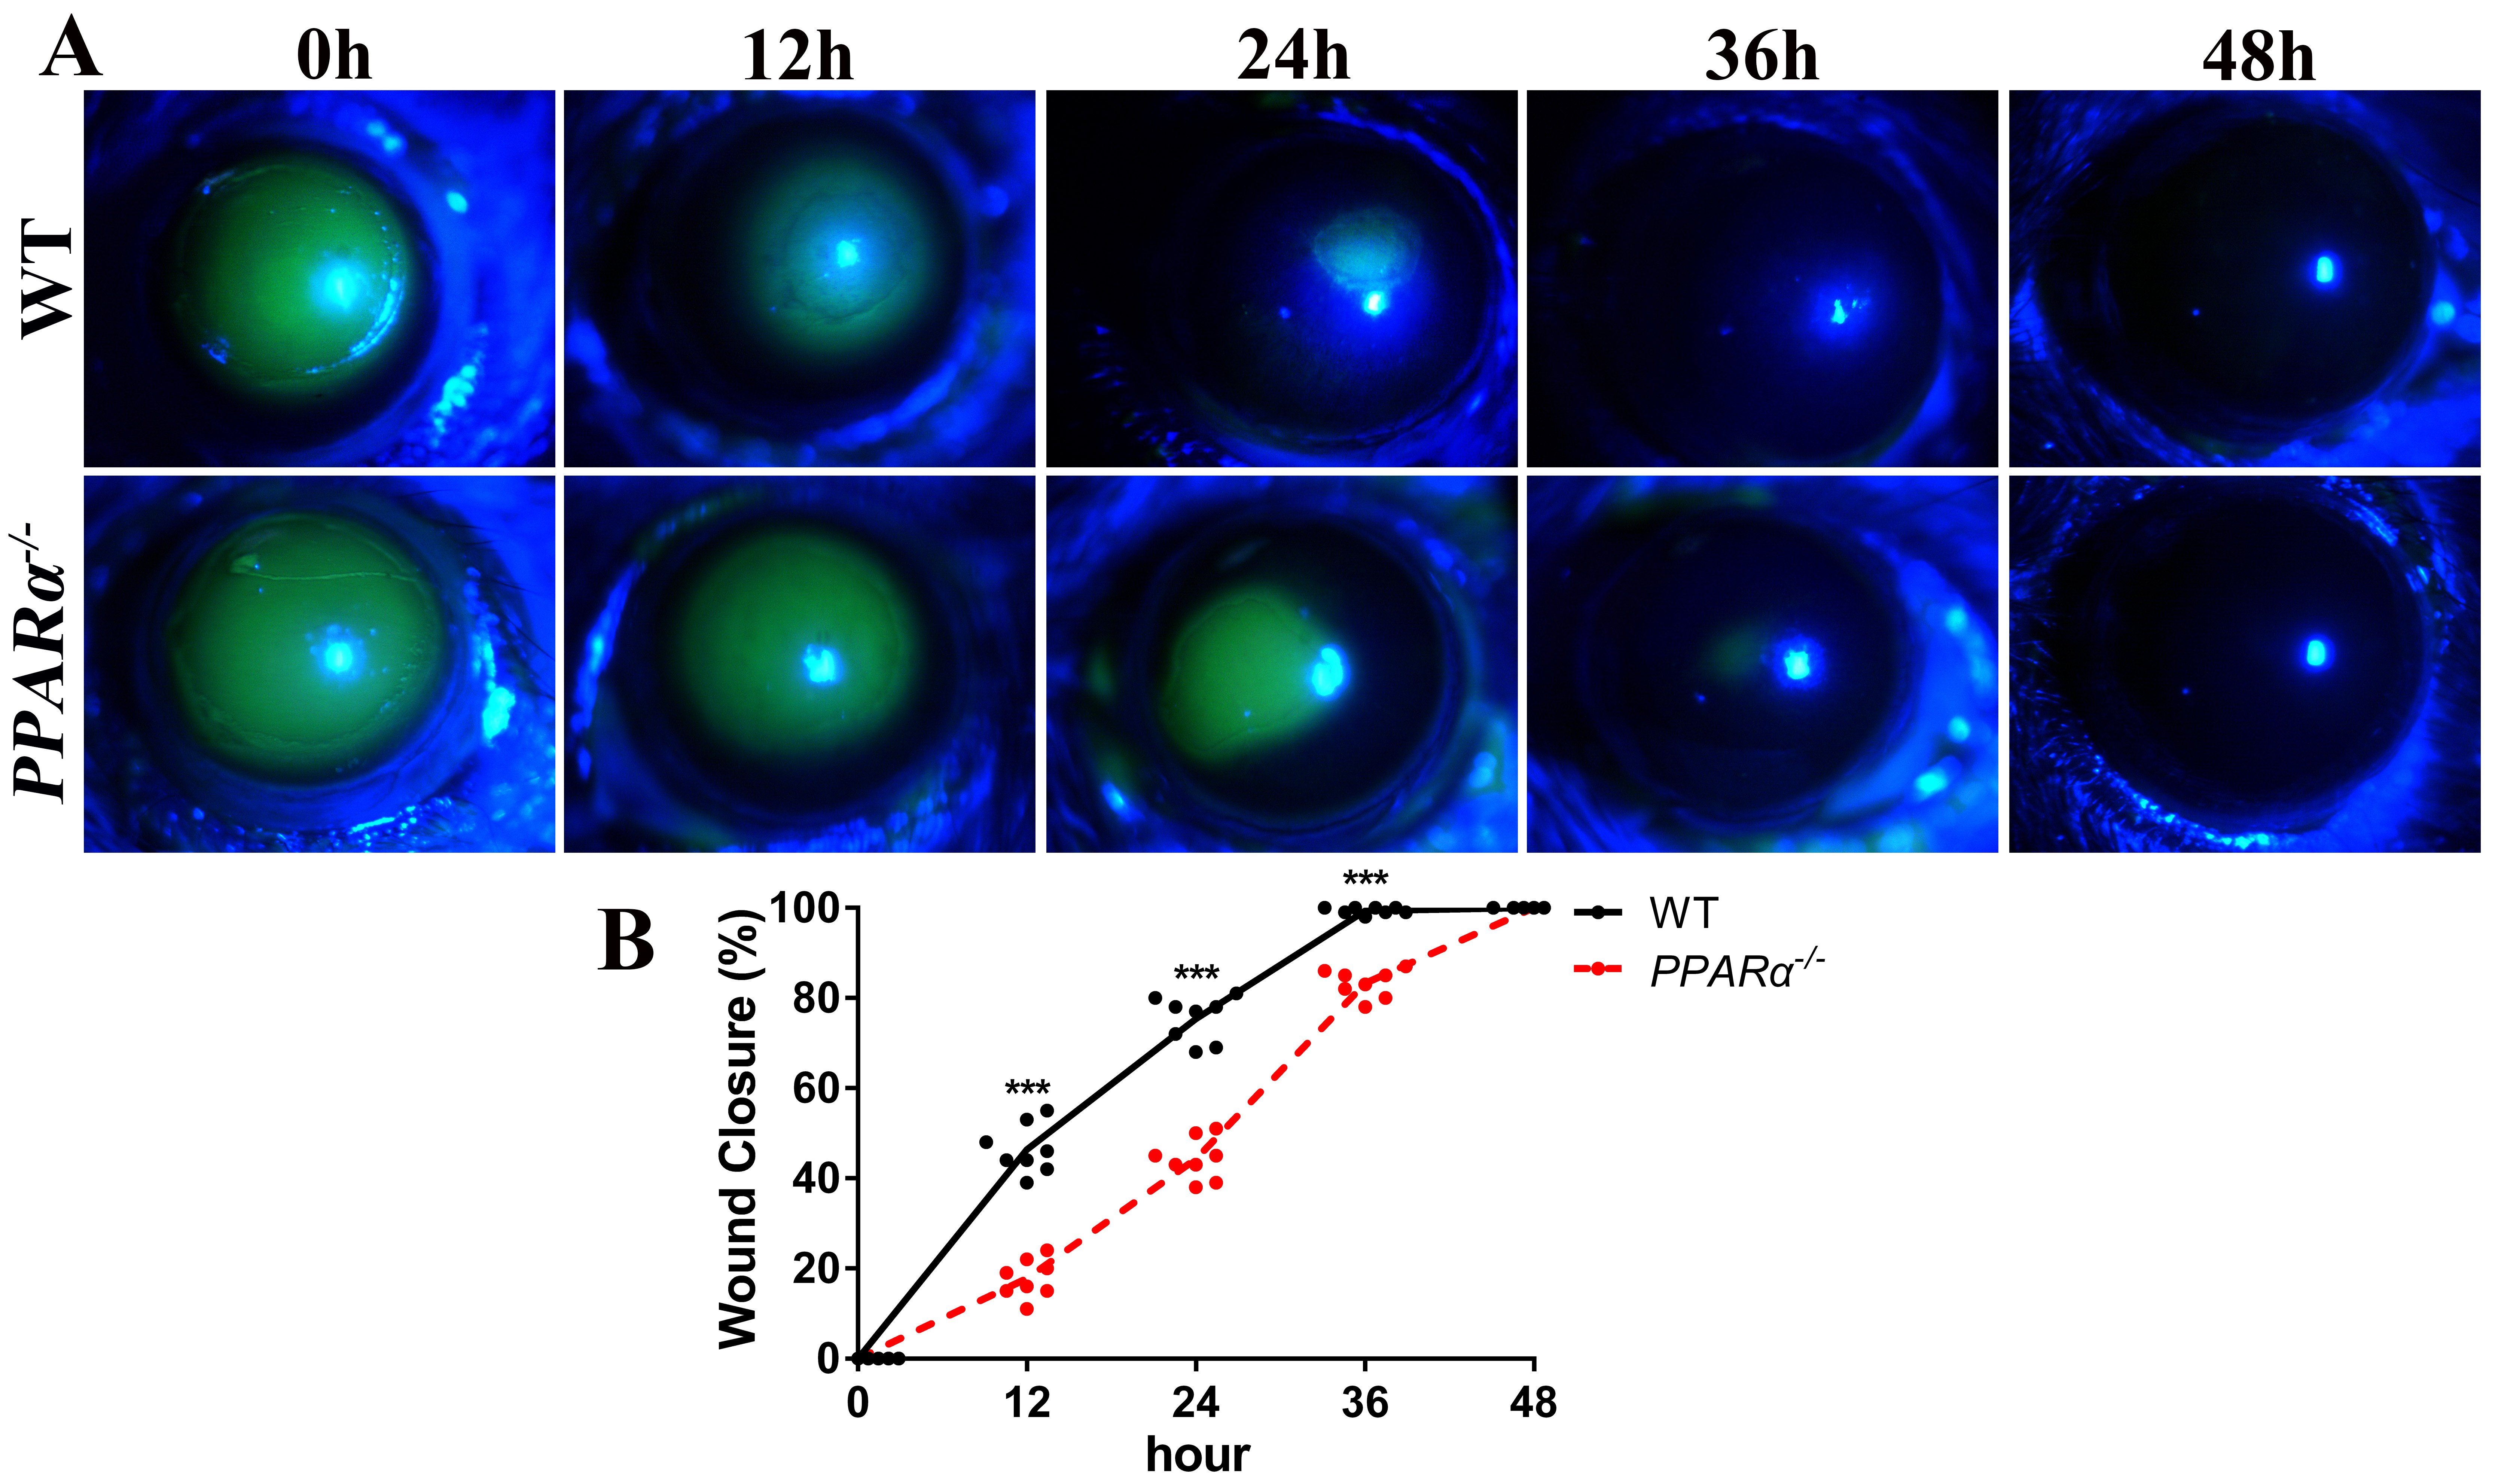
 Figure 3 of
Wu, Mol Vis 2024; 30:410-420.
Figure 3 of
Wu, Mol Vis 2024; 30:410-420.