Figure 2. Genomic annotation of the BMAL1 transcription factor. (A) Bar chart showing genomic feature distribution for BMAL1 in human Müller cells, (B) distribution of peaks across transcript region showing enriched peaks for protein-coding and non-coding RNA regions. (C) ClueGo enrichment network illustrating the functional roles associated with the 89 genes with BMAL1 promoter binding sites.
Functional themes are represented by different colors.
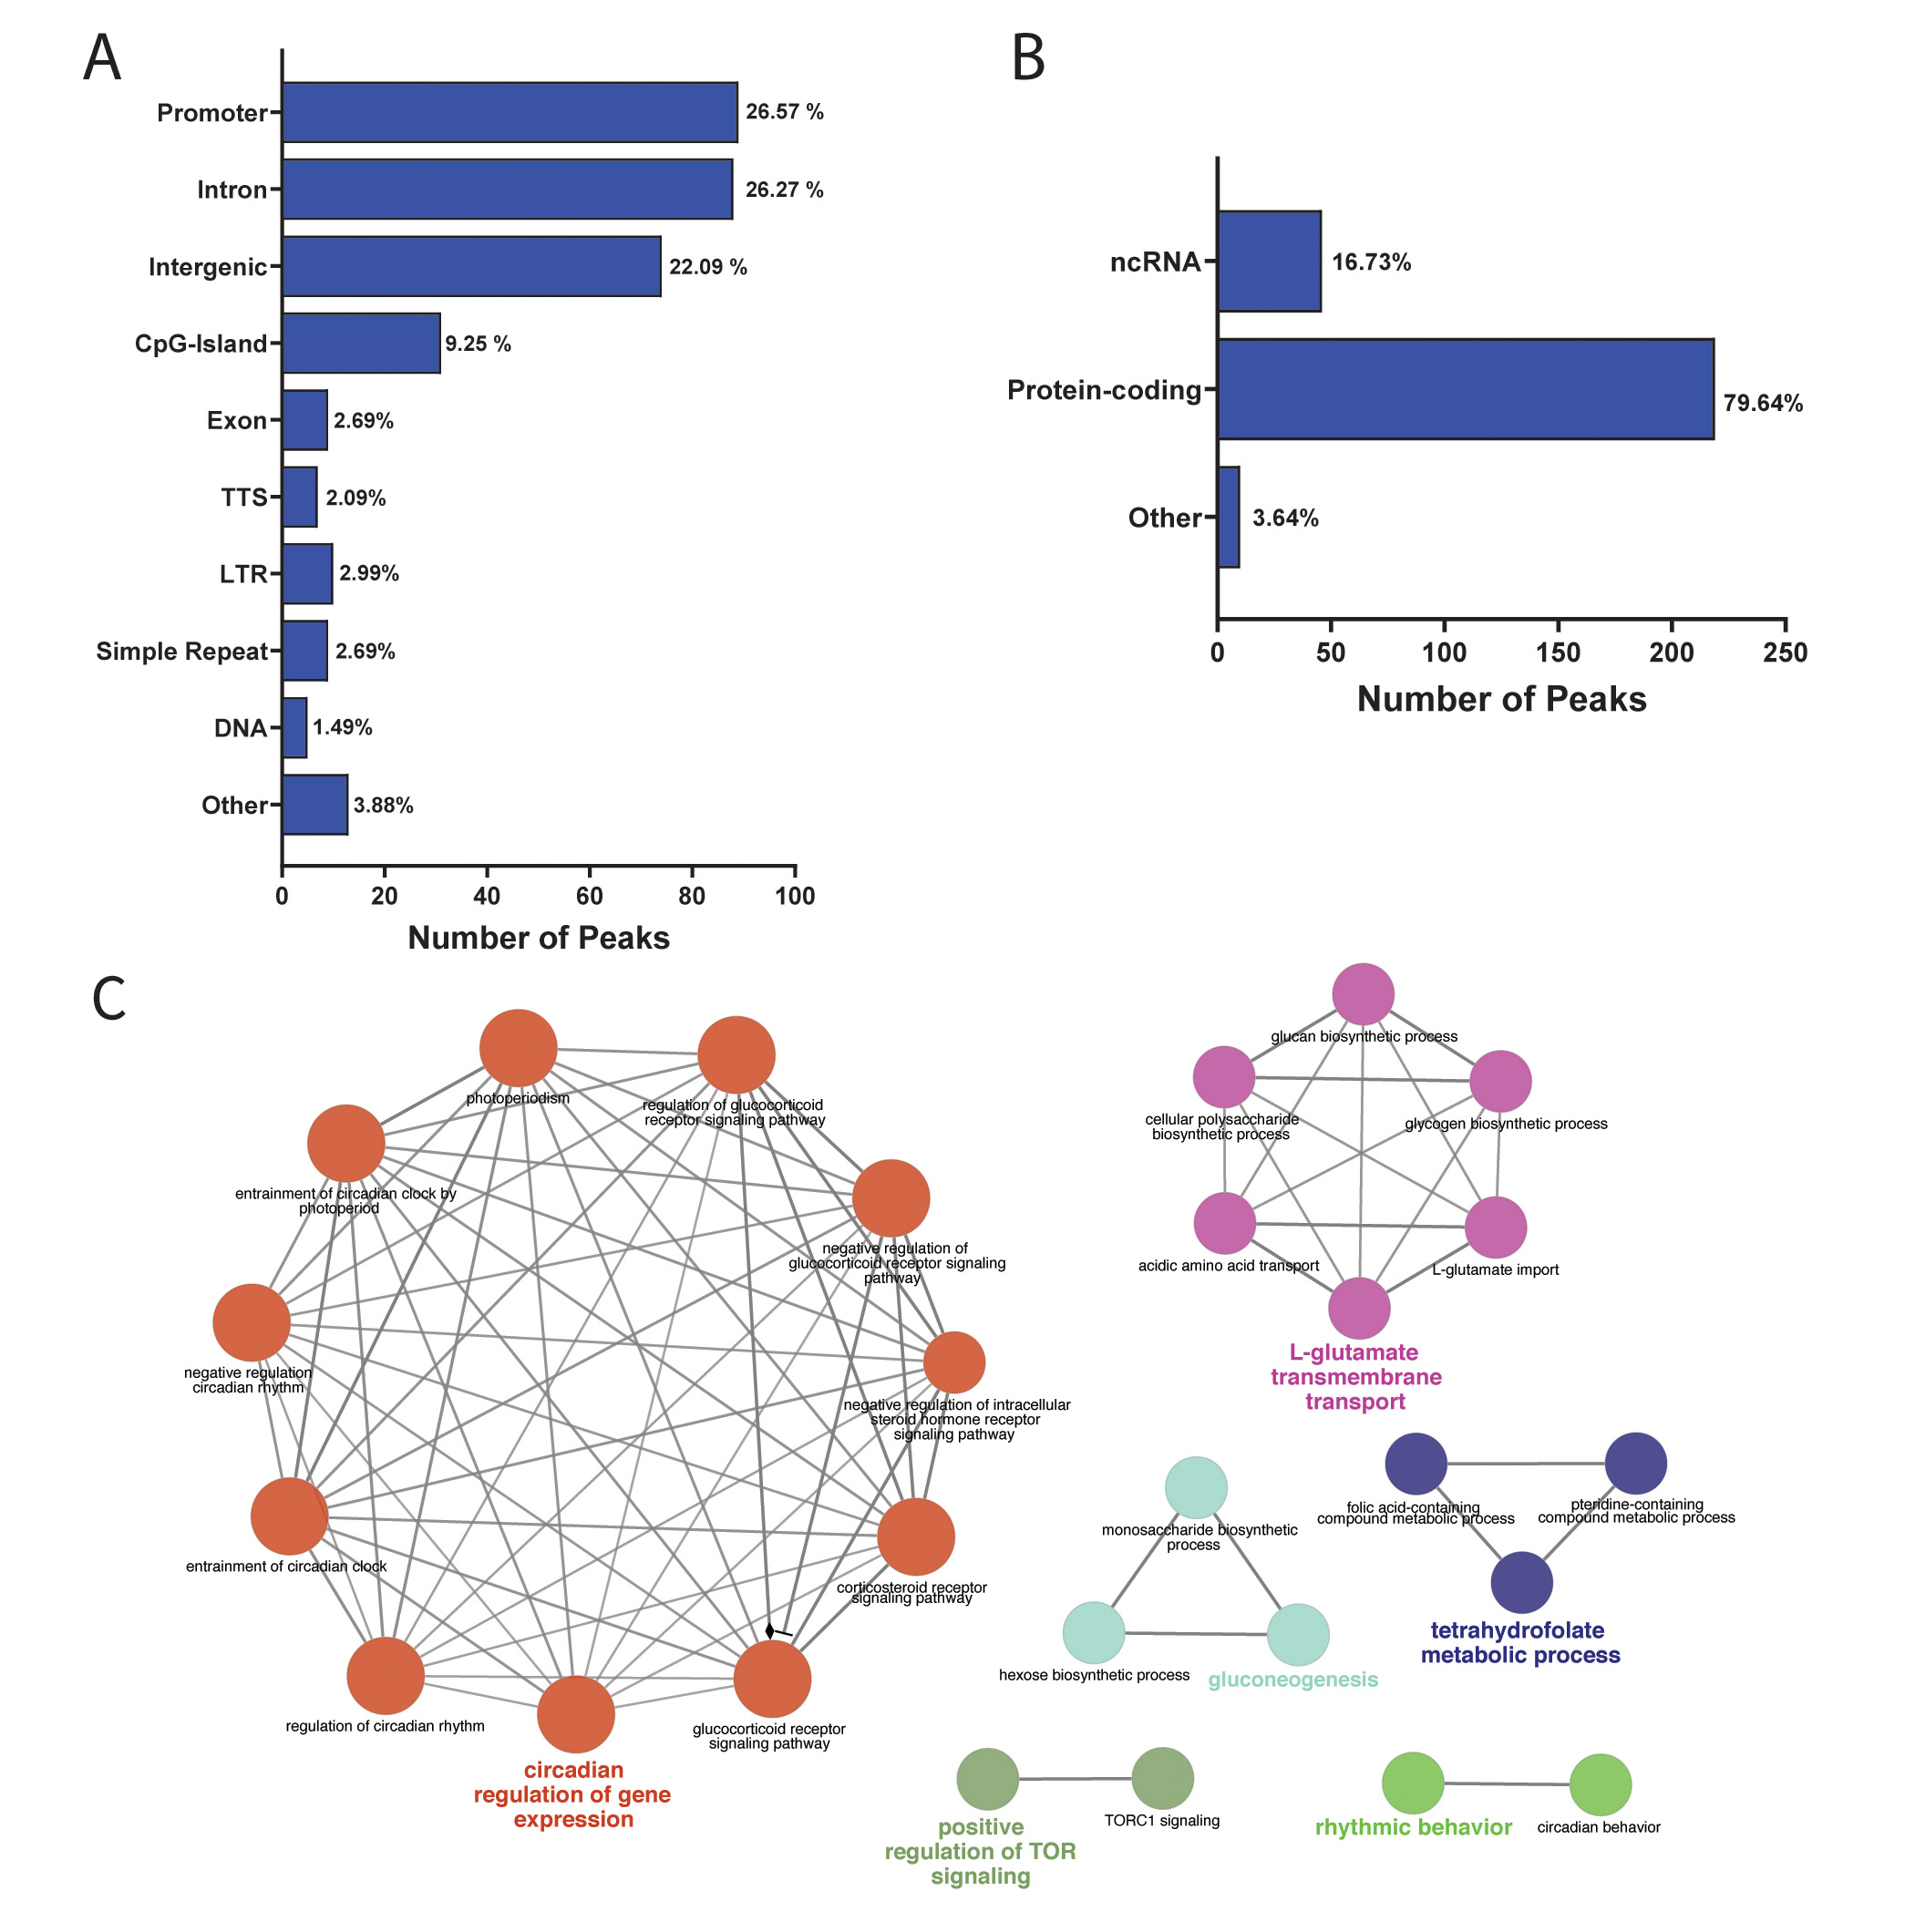
 Figure 2 of
Luo, Mol Vis 2024; 30:379-389.
Figure 2 of
Luo, Mol Vis 2024; 30:379-389.