Figure 3. Guanidine hydrochloride unfolding of wild-type (black squares) and Y134X mutant human γD-crystallin (brown circles). Protein
samples were excited at 295 nm, and the relative emission intensity of the 350 nm fluorescence (denatured form) was compared
to that of the 330 nm (native protein) and recorded as a function of the denaturant concentration. The line indicates the
fitted data, and the blocks stand for raw data. Protein concentration: 0.1 mg/ml; excitation emission slits: 10 nm. The data
were acquired from two independent experiments of two separate sets of samples.
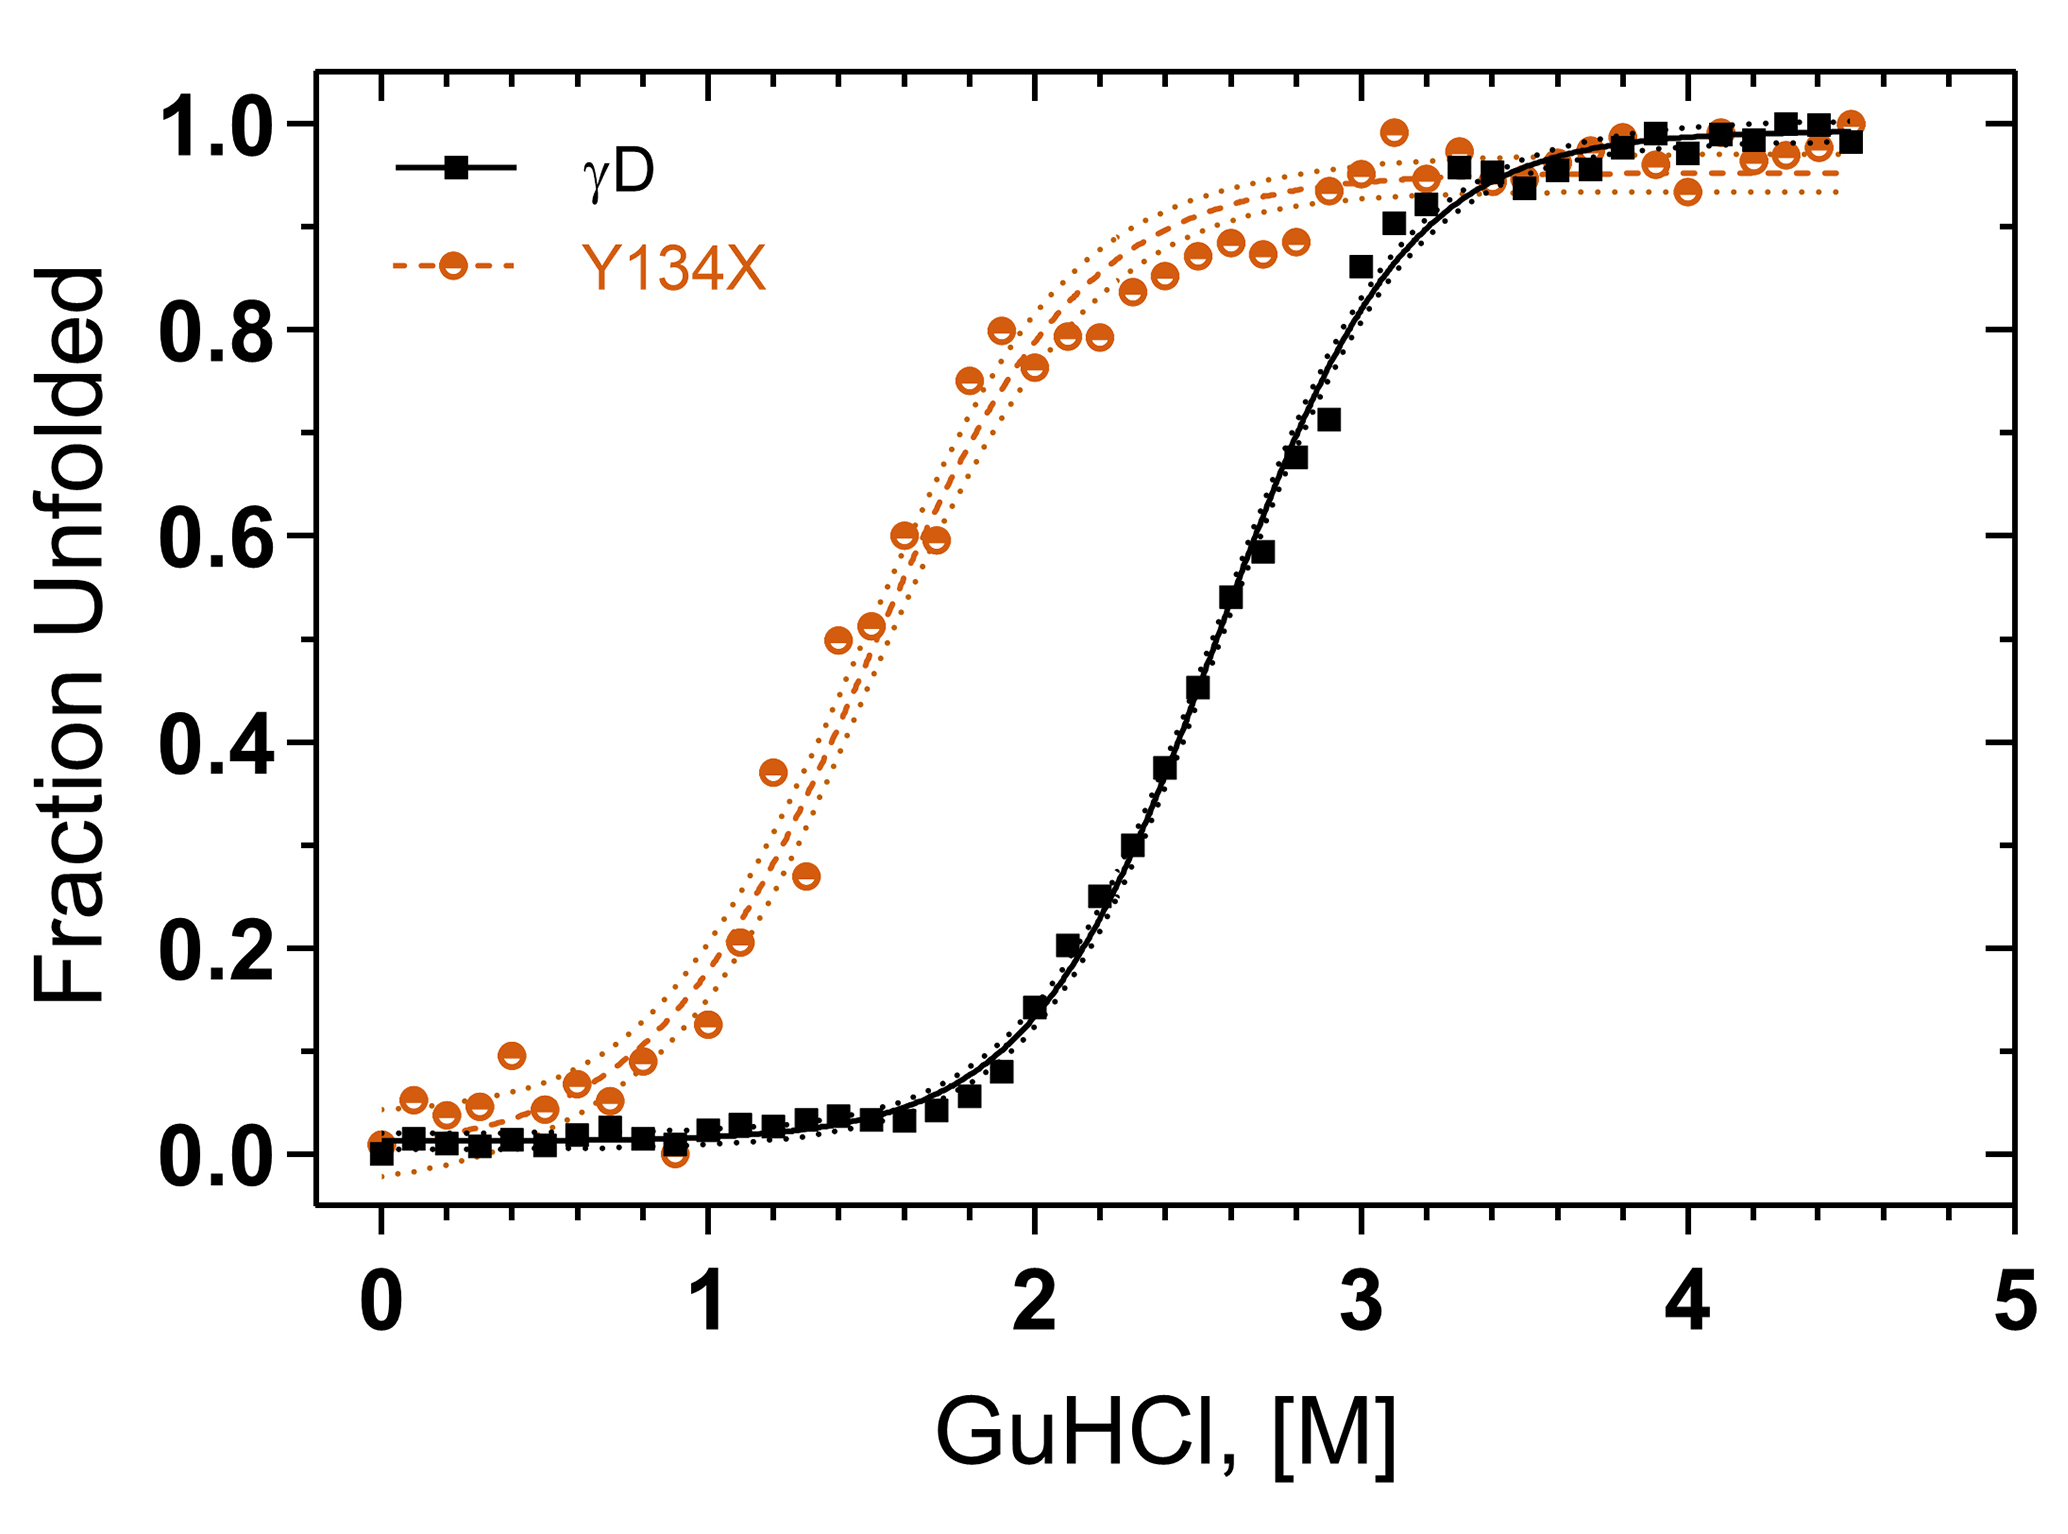
 Figure 3 of
Vendra, Mol Vis 2024; 30:37-48.
Figure 3 of
Vendra, Mol Vis 2024; 30:37-48.