Figure 3. Advaita iPathway analysis of differentially expressed pathways/genes between 0H and 24H human equatorial lens epithelial cells.
A: Impact analysis of the DEGs suggest that the KEGG pathway map “cytokine-cytokine receptor interaction” (yellow dot) is likely
to be the most significantly impacted pathway in the 24H human equatorial LECs. B: Bar graph showing the cytokine-cytokine receptor interaction genes that are differentially expressed in the 24H human equatorial
LECs. C: Impact analysis showing that the second most significant pathway in the 24H human equatorial LECs represent genes involved
in the “neuroactive ligand-receptor interaction” pathway (yellow dot). D: Bar graph showing the “neuroactive ligand-receptor interaction” pathway genes differentially expressed in the 24H human
equatorial LECs. E) Bar graph showing the “epithelial to mesenchymal transition” pathway genes differentially expressed in
the 24H human equatorial LECs.
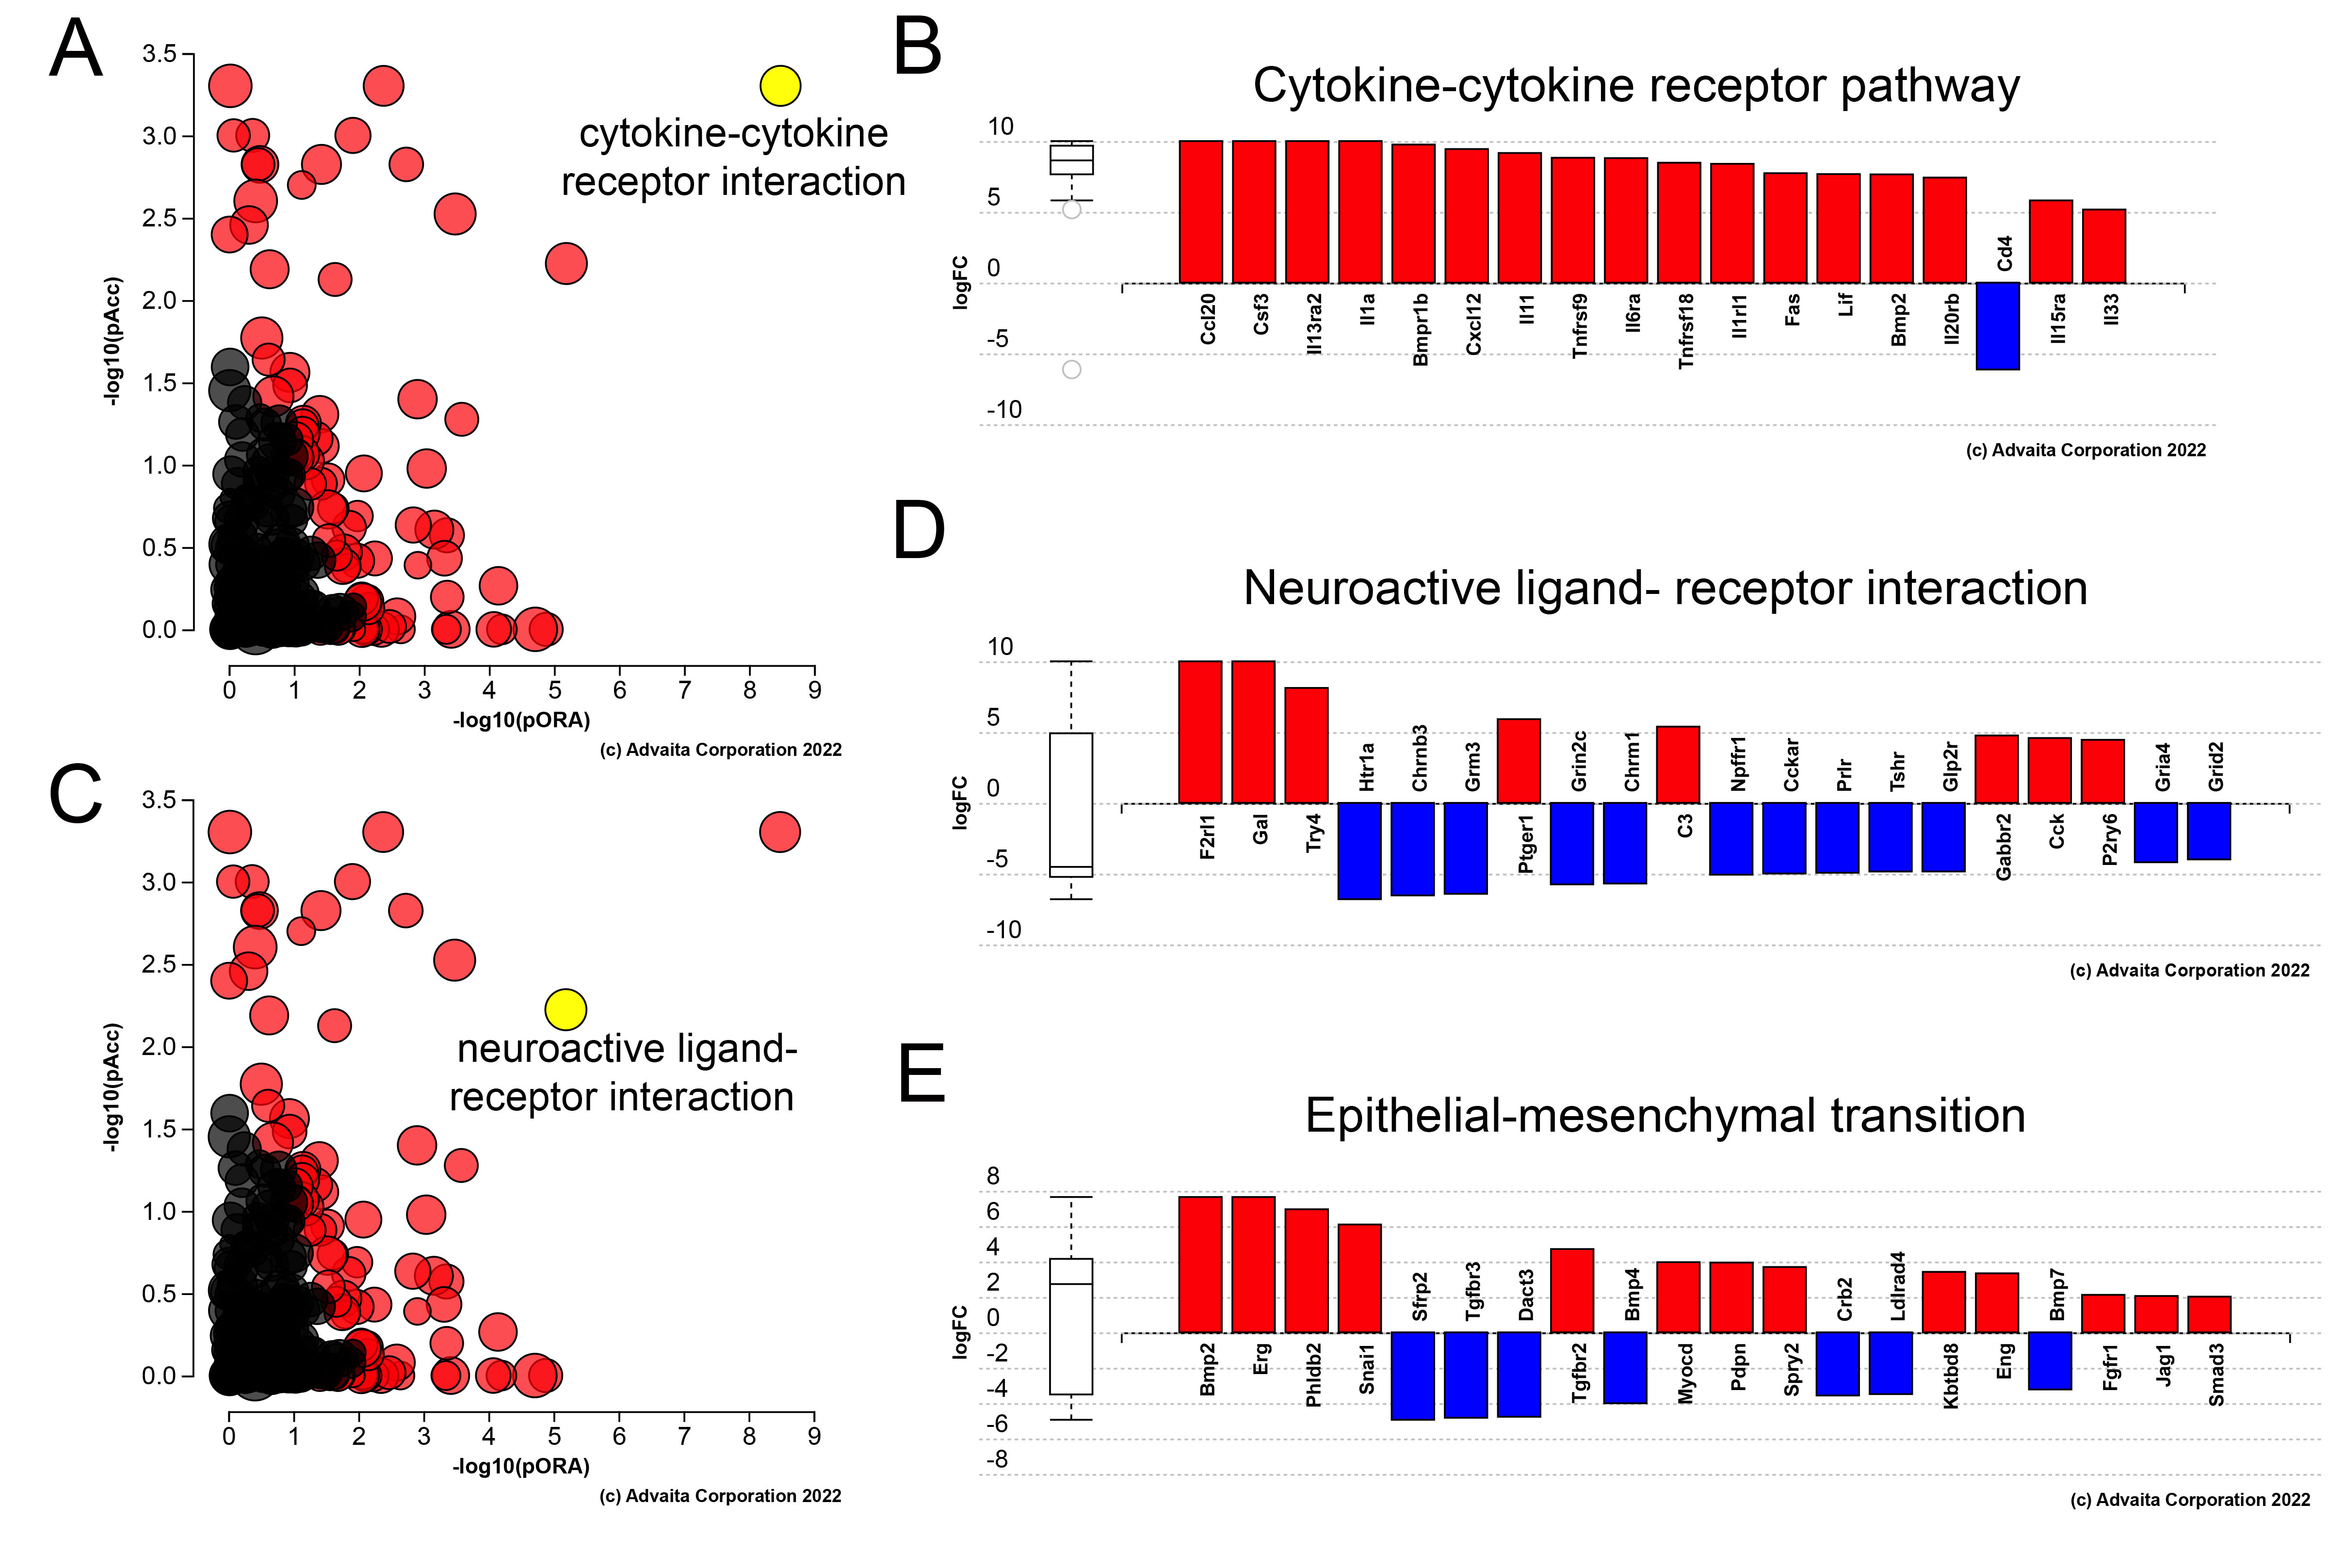
 Figure 3 of
Novo, Mol Vis 2024; 30:348-367.
Figure 3 of
Novo, Mol Vis 2024; 30:348-367.