Figure 2. Advaita iPathway analysis of differentially expressed pathways/genes between central lens epithelial compared to equatorial
epithelial. A: Bar graph showing the “differentially expressed pathway genes on calcium signaling pathway (p-value 1.65E-6) expressed more
highly in the 0H human equatorial LECs. B: Bar graph showing the “differentially expressed genes annotated to epithelial cell proliferation” (p value 3.600E-4) expressed
more highly in the 0H human equatorial LECs. C: Bar graph showing the “differentially expressed genes annotated with cell adhesion” (p value 4.400E-18) expressed more highly
in the 0H human equatorial LECs. D: Bar graph showing the “differentially expressed genes annotated with cell junction assembly” (p value 8.700E-8) expressed
more highly in the 0H human equatorial LECs. E: Bar graph showing the “differentially expressed genes annotated with cation transport” (p value 2.500E-8) expressed more
highly in the 0H human equatorial LECs. Red bars are genes that are expressed more highly in the equatorial lens epithelial
cells compared to central lens epithelial cells. Blue bars are genes that are expressed more highly in central lens epithelial
cells compared to equatorial lens epithelial cells.
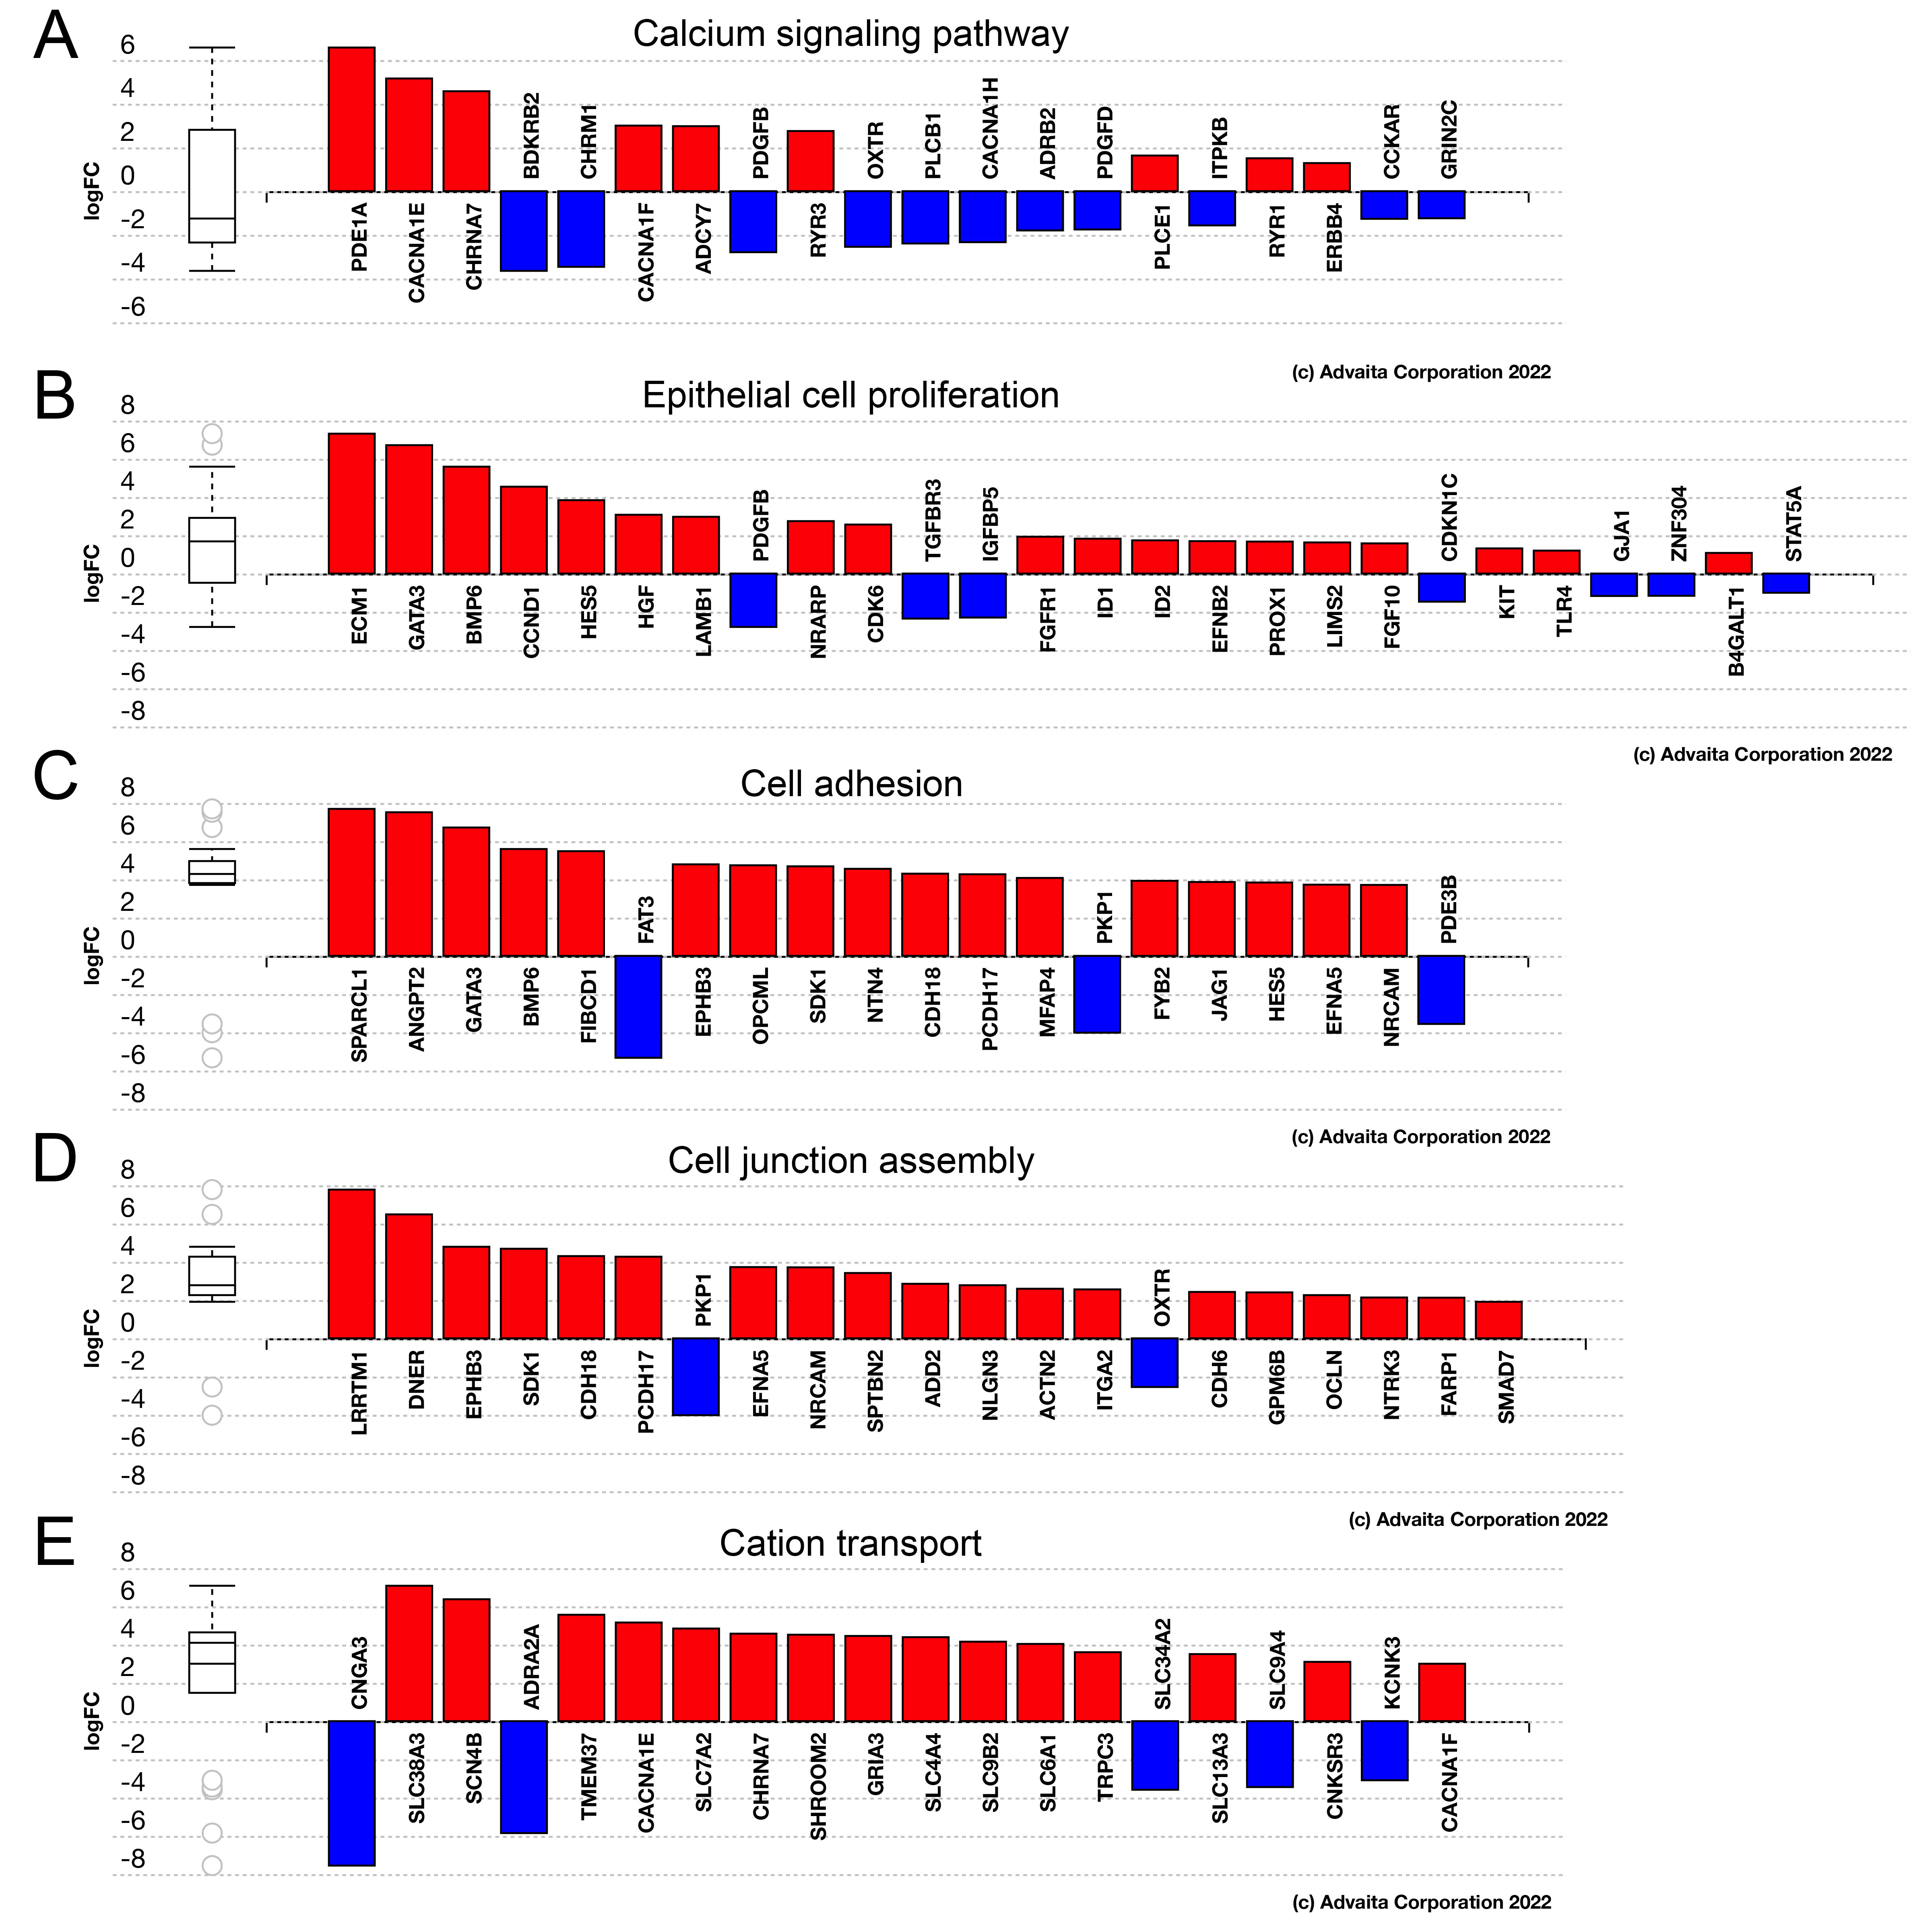
 Figure 2 of
Novo, Mol Vis 2024; 30:348-367.
Figure 2 of
Novo, Mol Vis 2024; 30:348-367.