Figure 1. m6A modification levels and WTAP expression increased after laser photocoagulation. A: Quantitative analysis of m6A showed a trend in the m6A level compared with the normal control group. B: Using qRT-PCR analysis to detect the expression of ALKBH5, WTAP, FTO, METTL3, and METTL14. Western blot was used to detect
the expression of ALKBH5 (C), FTO (D), METTL3 (E), WTAP (F), and METTL14 (G). The statistical analyses were compared with the normal group. H: Immunohistochemistry was used to analyze the expression of WTAP in the normal control group and the 7-day group. Scale bar
= 100 microns [ganglion cell layer (GC), inner plexiform layer (IPL), inner nuclear layer (INL), outer plexiform layer (OPL),
outer nuclear layer (ONL), inner segment/outer segment (IS/OS); retinal pigment epithelium (RPE)].
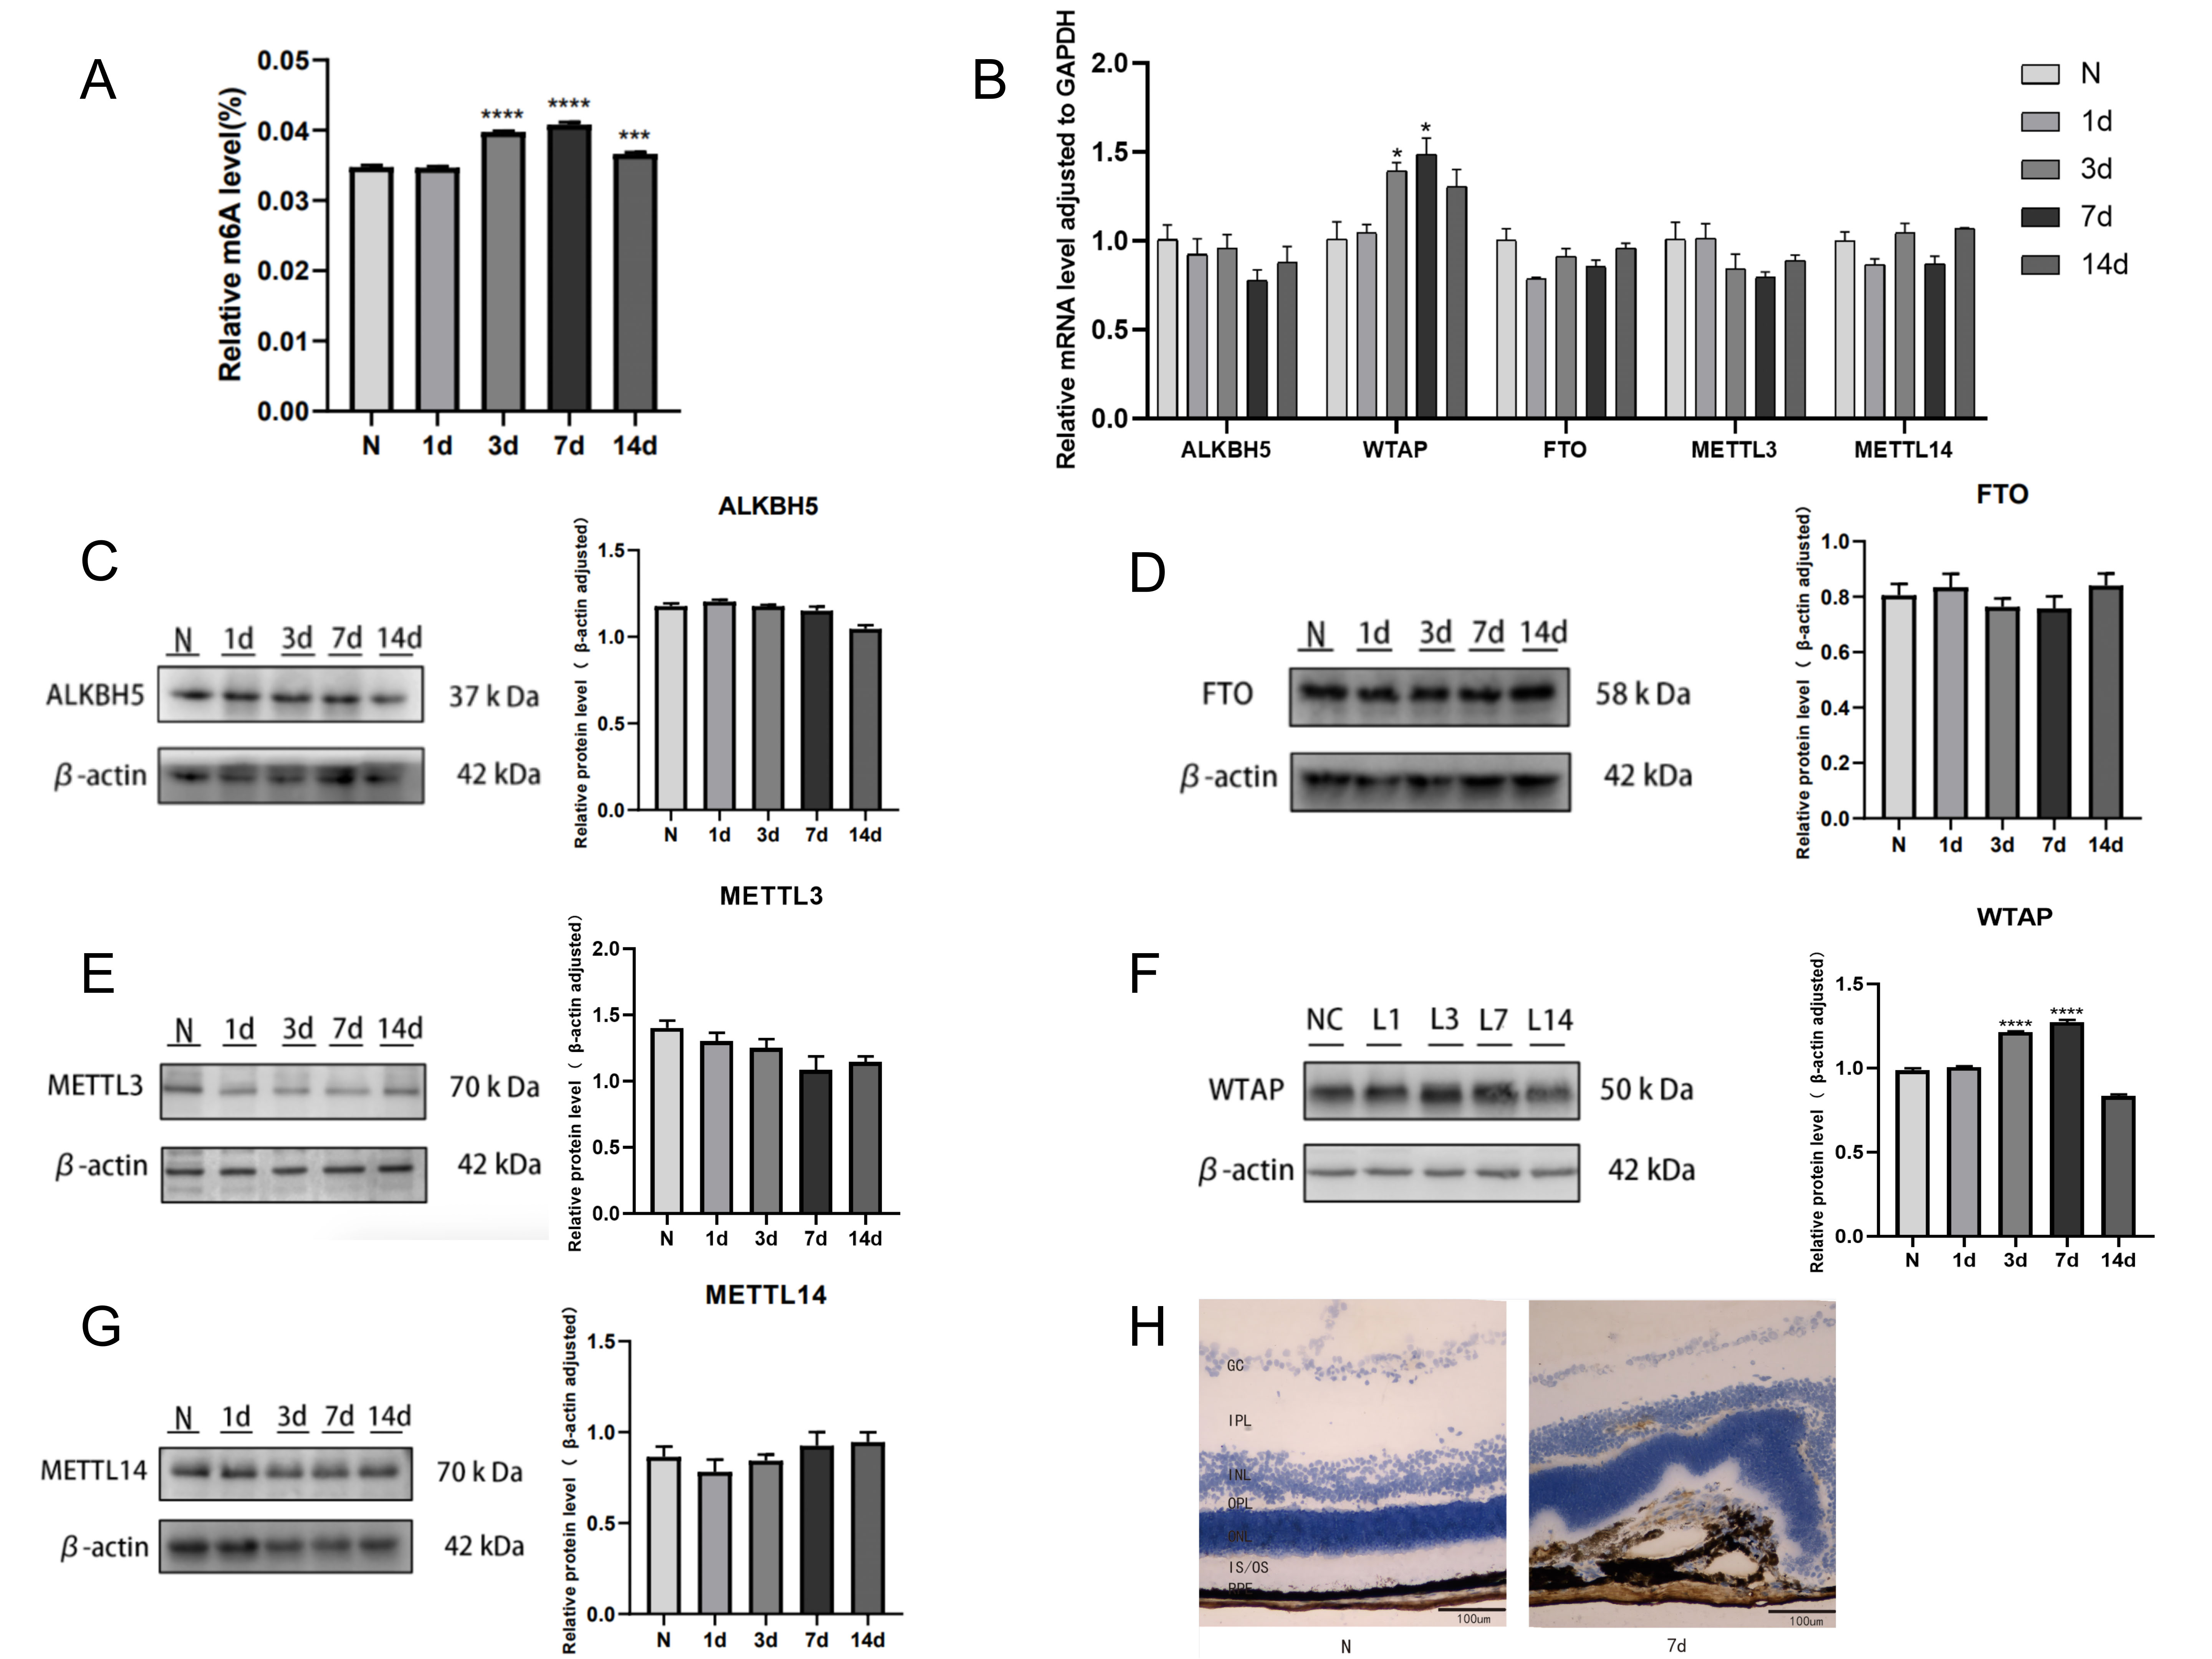
 Figure 1 of
Gong, Mol Vis 2024; 30:336-347.
Figure 1 of
Gong, Mol Vis 2024; 30:336-347.