Figure 1. Entropy-based SNP-SNP interaction network of 10 polymorphisms of the genes in the case and control groups. The percent of
the entropy for independent factors as well as their interactions are represented in the graph where positive percentage of
entropy denotes more than additive or synergistic interaction while negative percentage denotes redundancy. The best multifactor
dimensionality reduction (MDR) model for gene-gene interaction. Here, the red and orange color indicates more than additive
or synergistic interaction and gold color denotes the mid-point, green color represents moderate redundancy while blue color
denotes the highest.
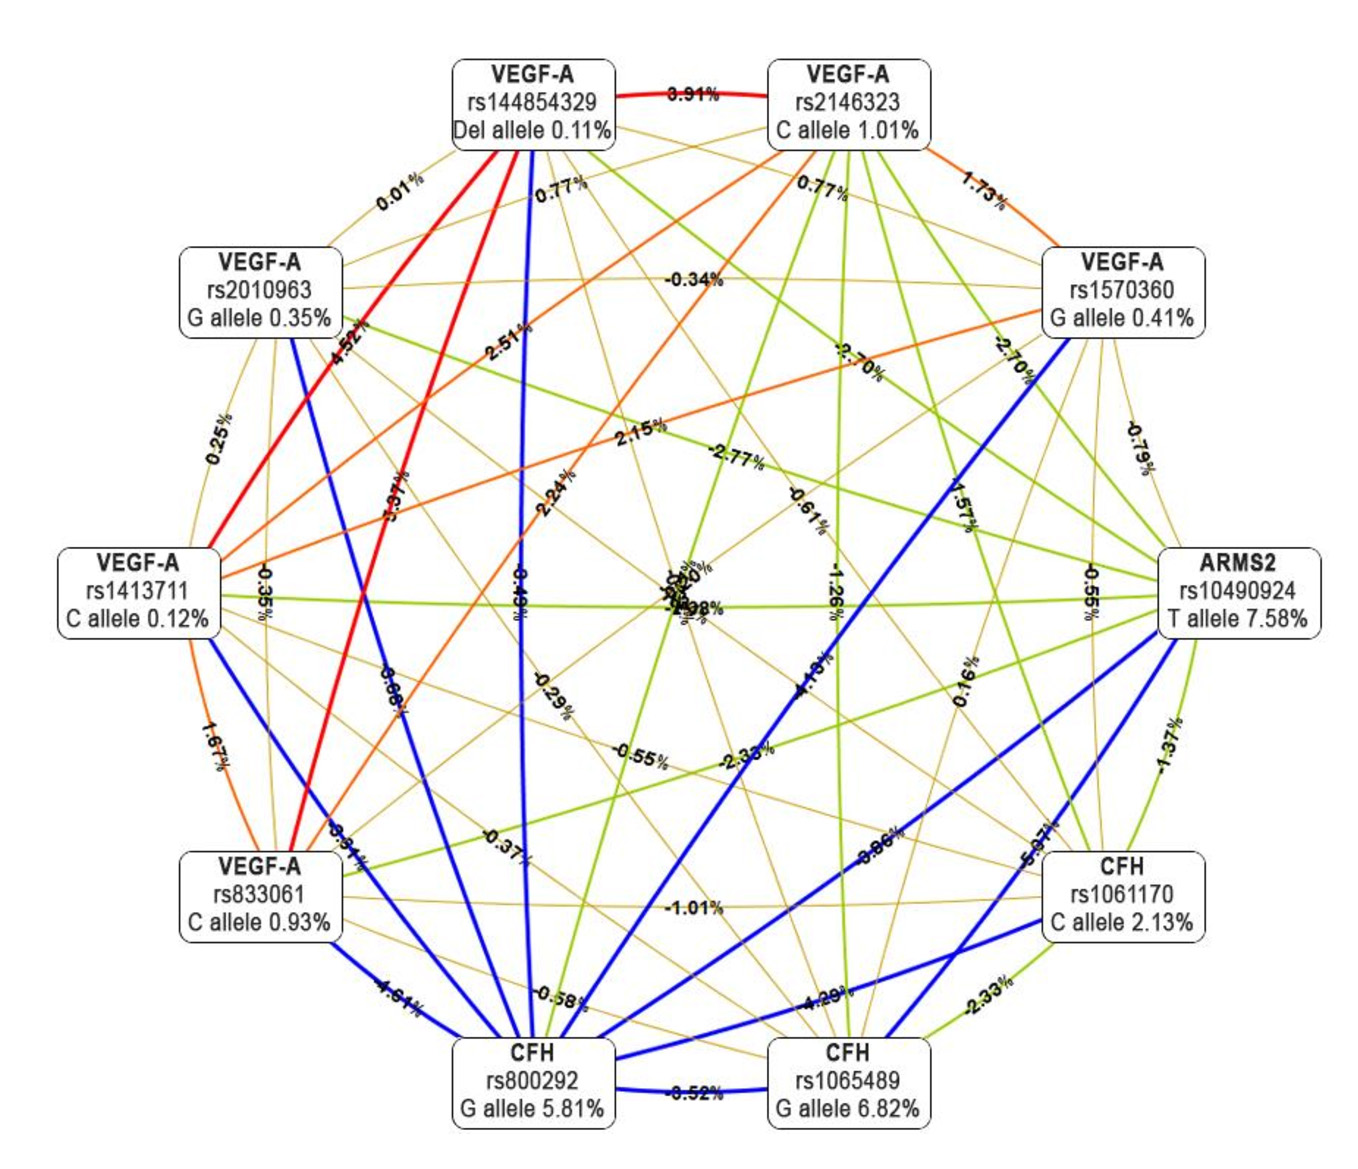
 Figure 1 of
Altankhuyag, Mol Vis 2024; 30:320-335.
Figure 1 of
Altankhuyag, Mol Vis 2024; 30:320-335.