Figure 4. Comparison of corneal epithelial thickness and corneal epithelial cell count among MCD patients and the control group. A: Scatter plot shows a significantly reduced corneal epithelial thickness observed in the patients with truncation mutations
compared to the control group. B: A significantly reduced count of corneal epithelial cells was observed in the patients with truncation mutations compared
to the control group. Quantification among the groups was performed using a one-way ANOVA. A p-value of less than 0.001 (***)
and a p-value of less than 0.05 (*) were considered statistically significant. (ns-not significant).
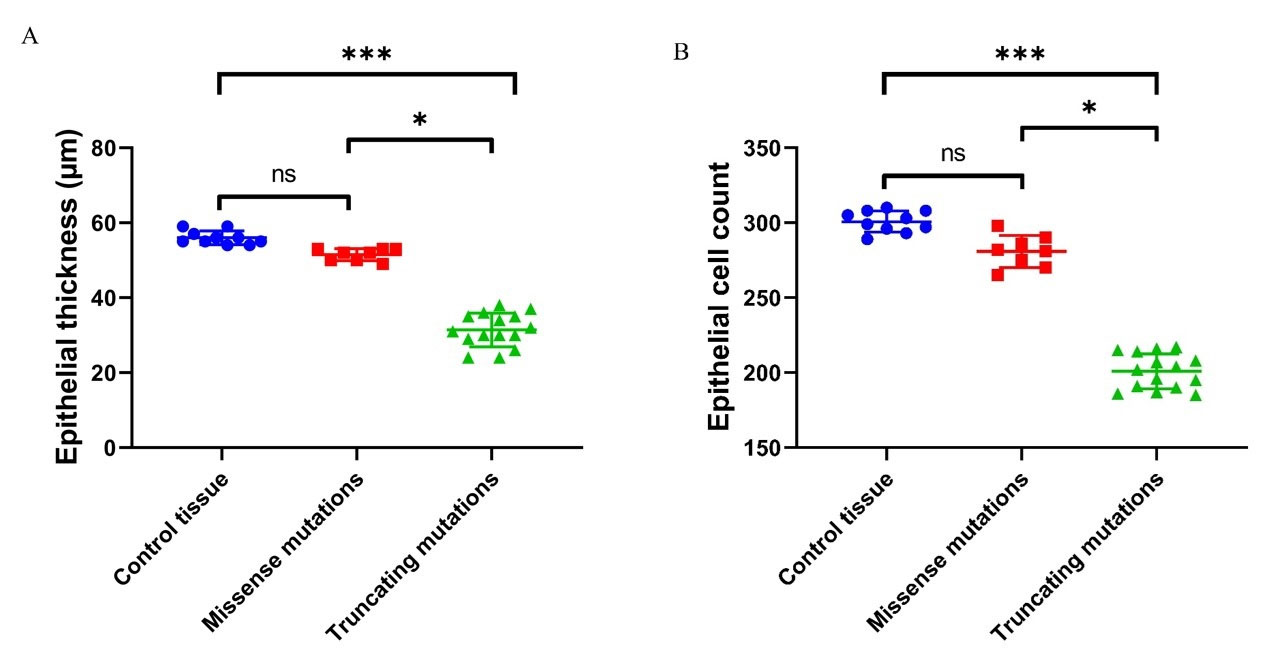
 Figure 4 of
Murugan, Mol Vis 2024; 30:305-318.
Figure 4 of
Murugan, Mol Vis 2024; 30:305-318.