Figure 3. Comparison of the central corneal thickness of MCD patients and the control group. Scatter plots show significantly reduced
central corneal thickness in patients with truncation mutations compared to the control group. Quantitative analysis among
the groups was performed using a one-way ANOVA. A p-value of less than 0.001 (***) was considered statistically significant
(ns, not significant).
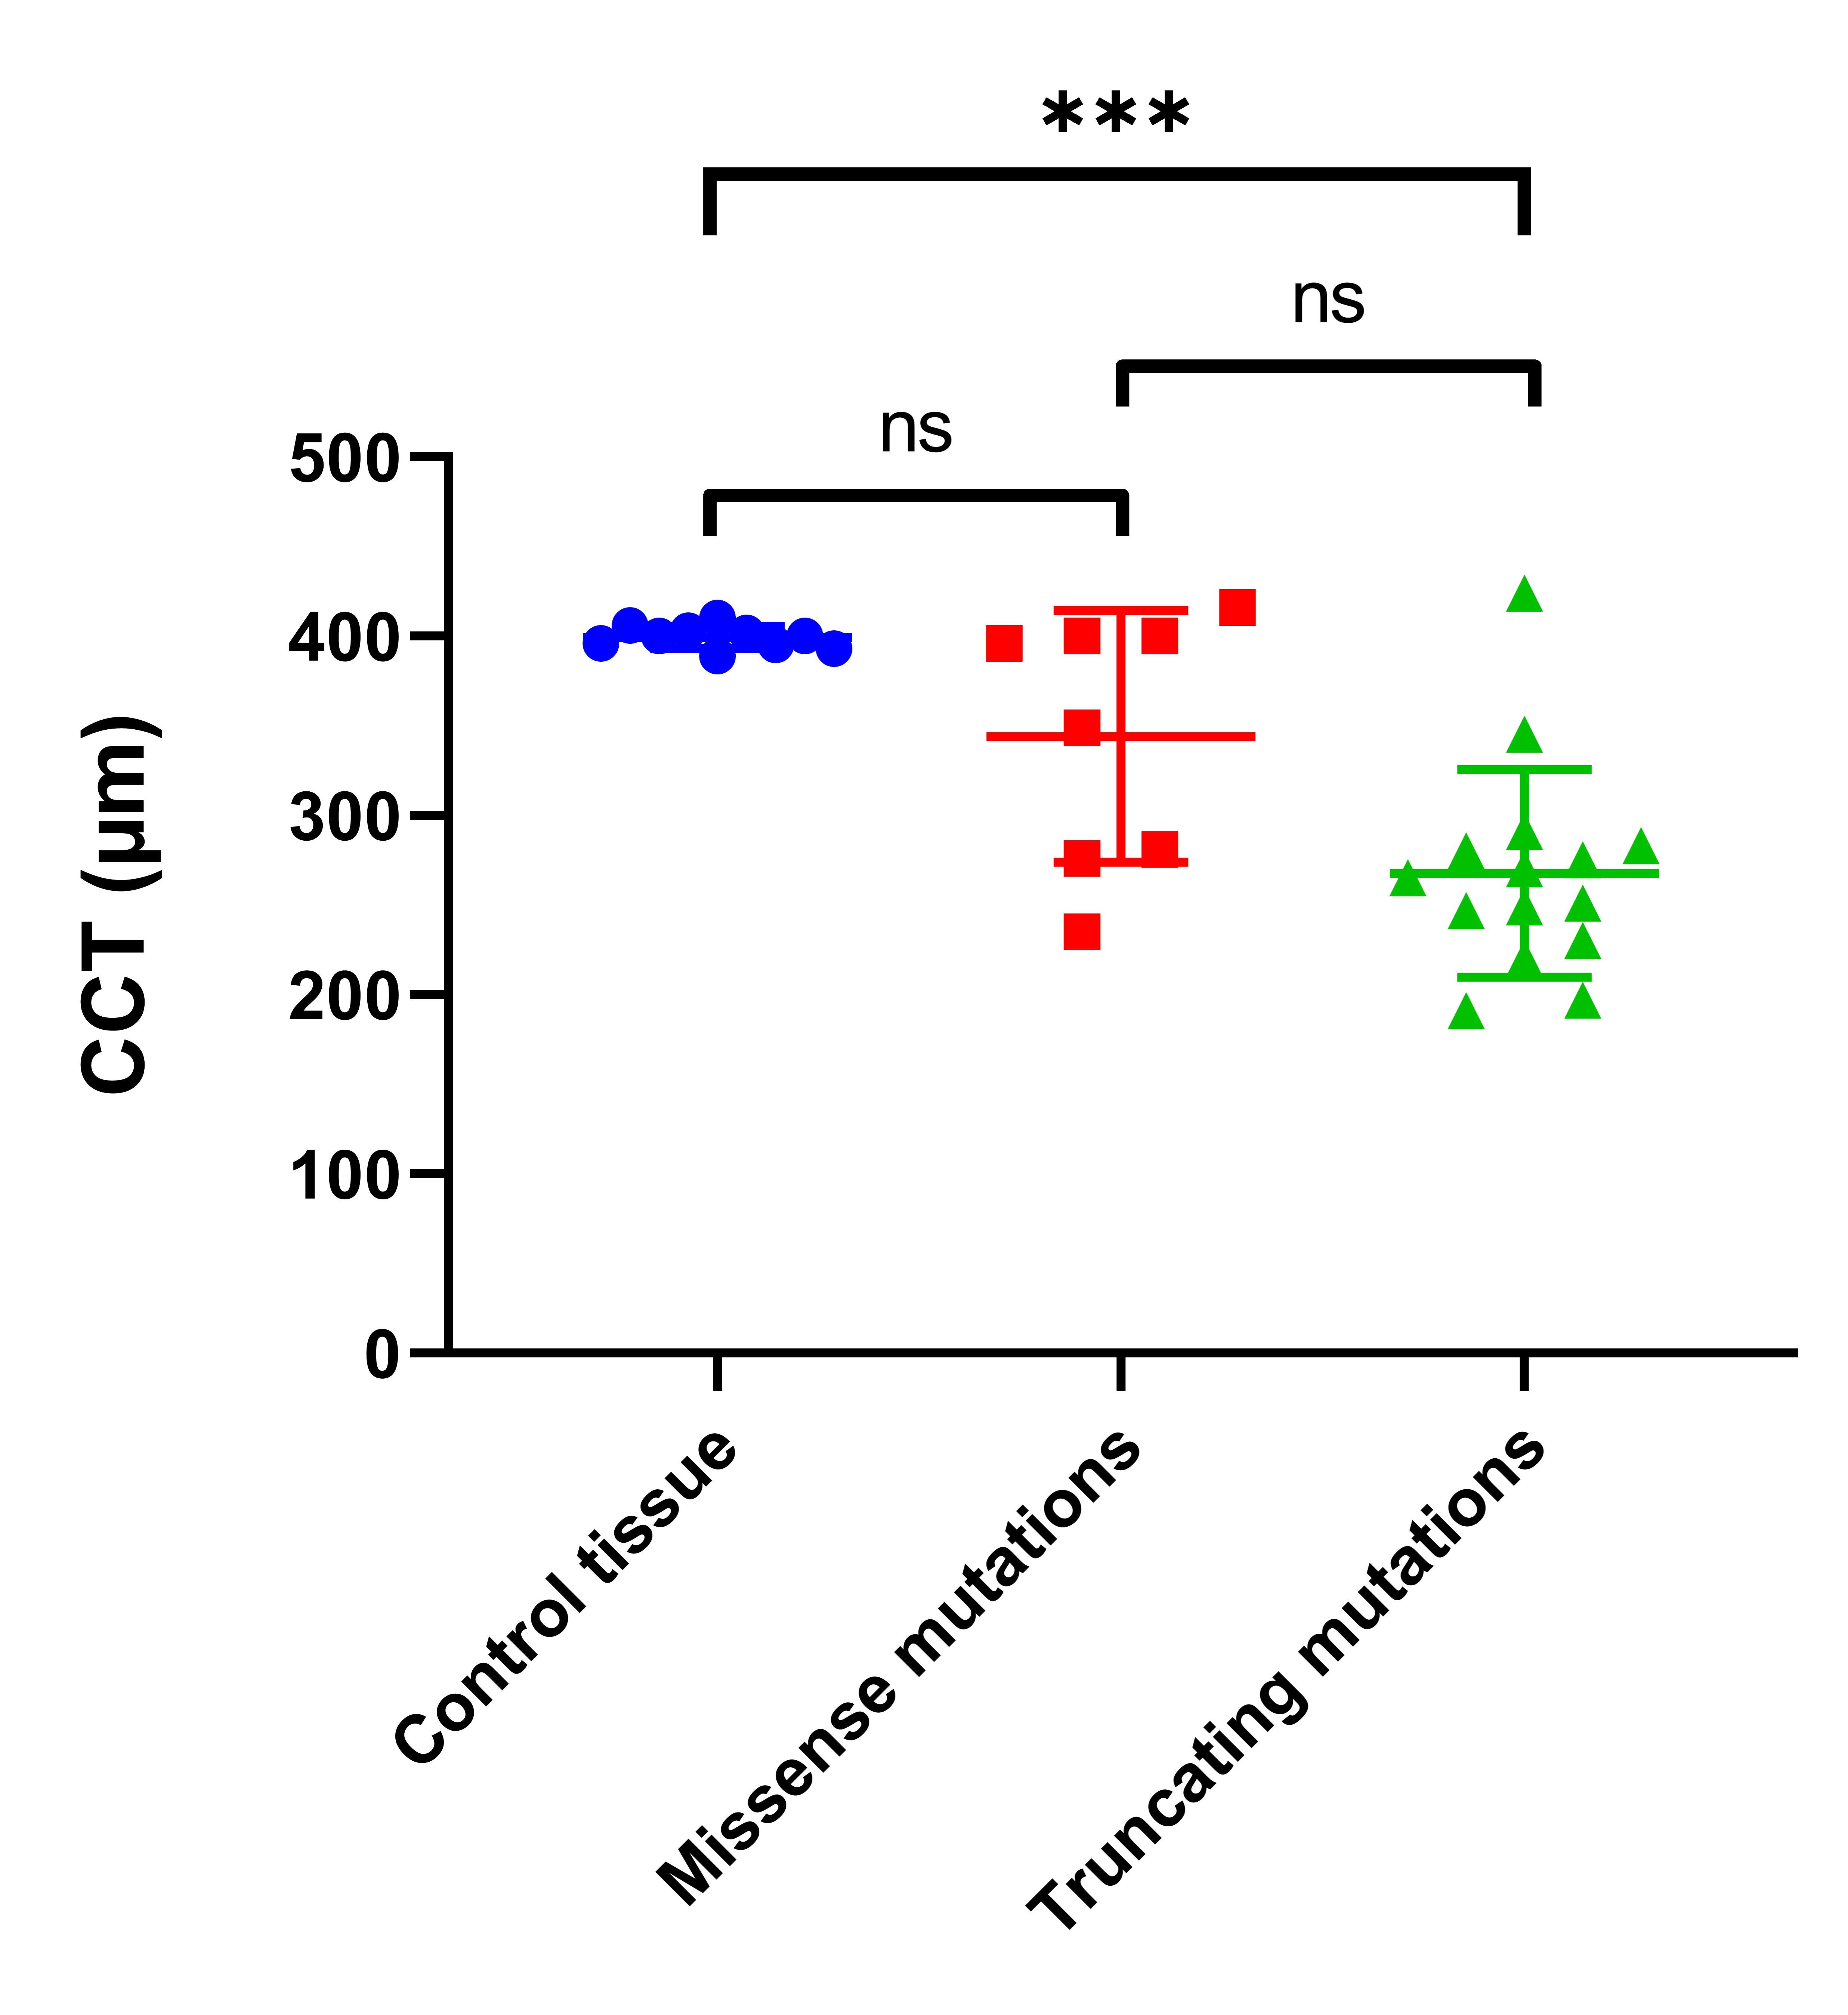
 Figure 3 of
Murugan, Mol Vis 2024; 30:305-318.
Figure 3 of
Murugan, Mol Vis 2024; 30:305-318.