Figure 3 of
Huang, Mol Vis 2024; 30:290-297.
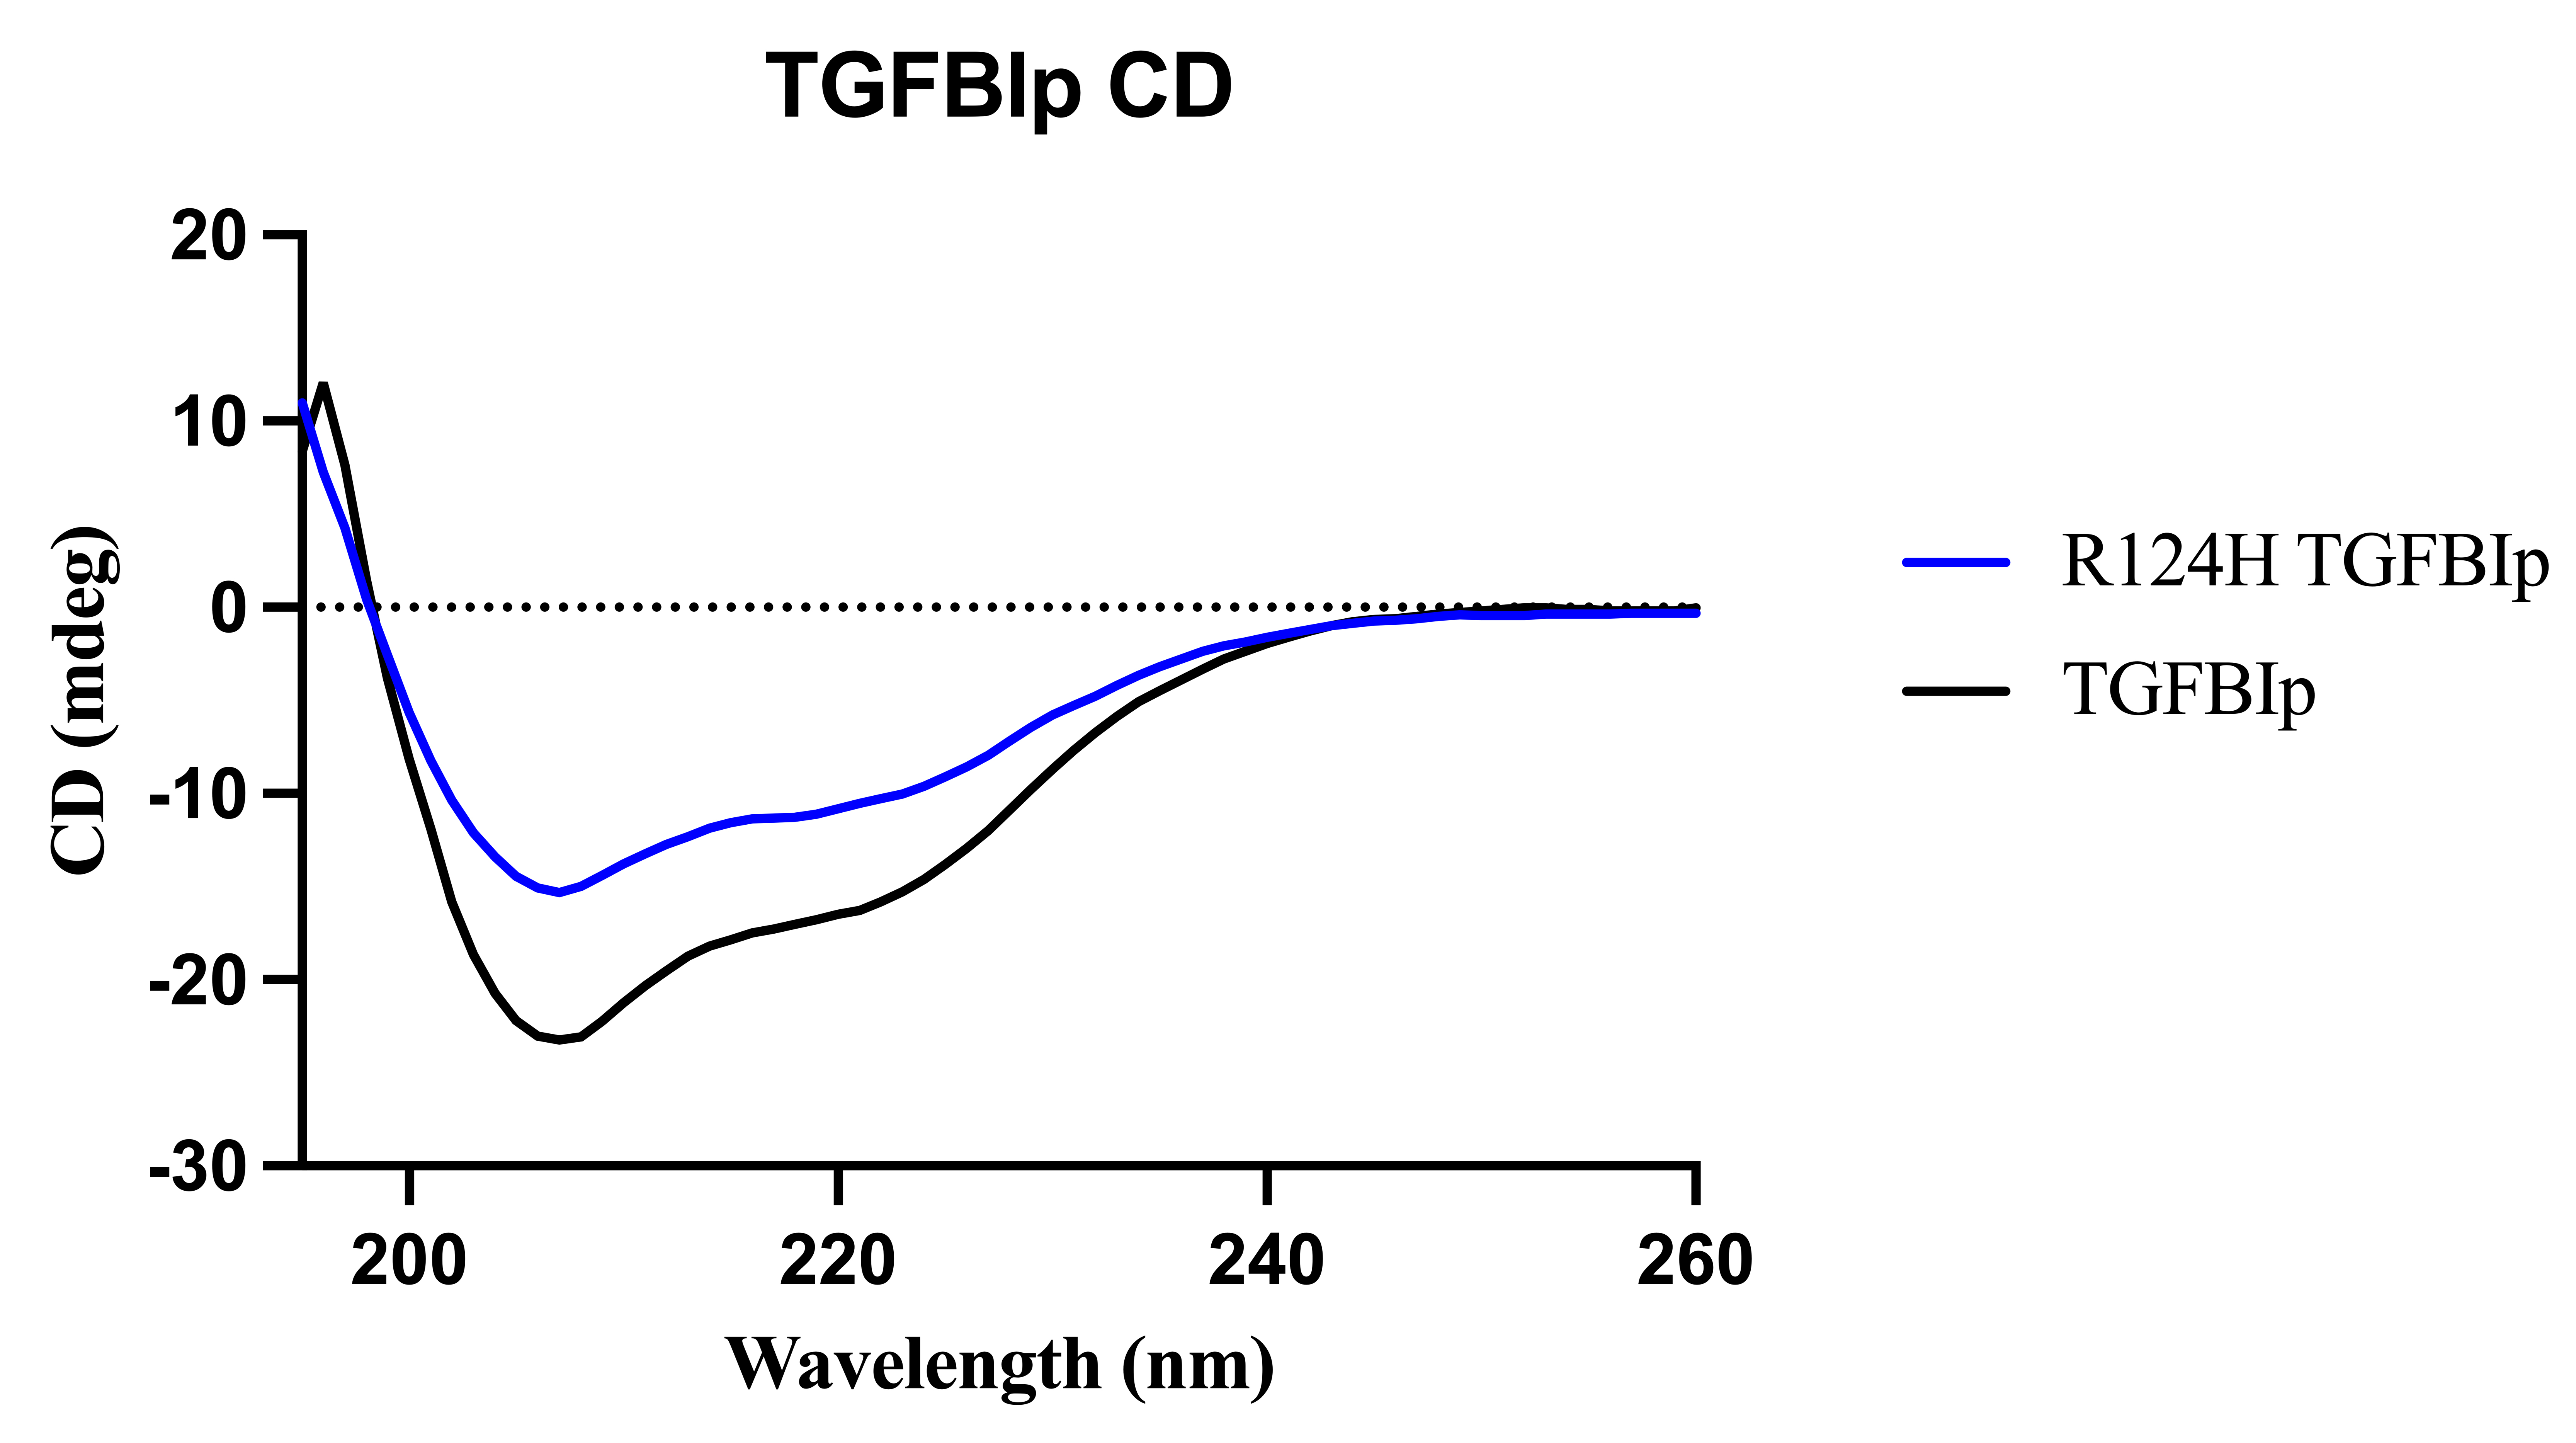
Figure 3.
The Wild-type and R124H TGFBIp CD results: The black curve represents wild-type TGFBIp, the blue curve represents R124H mutant TGFBIp.
 Figure 3 of
Huang, Mol Vis 2024; 30:290-297. Figure 3 of
Huang, Mol Vis 2024; 30:290-297.
Figure 3 of
Huang, Mol Vis 2024; 30:290-297. Figure 3 of
Huang, Mol Vis 2024; 30:290-297.