Figure 1 of
Santos, Mol Vis 2024; 30:279-288.
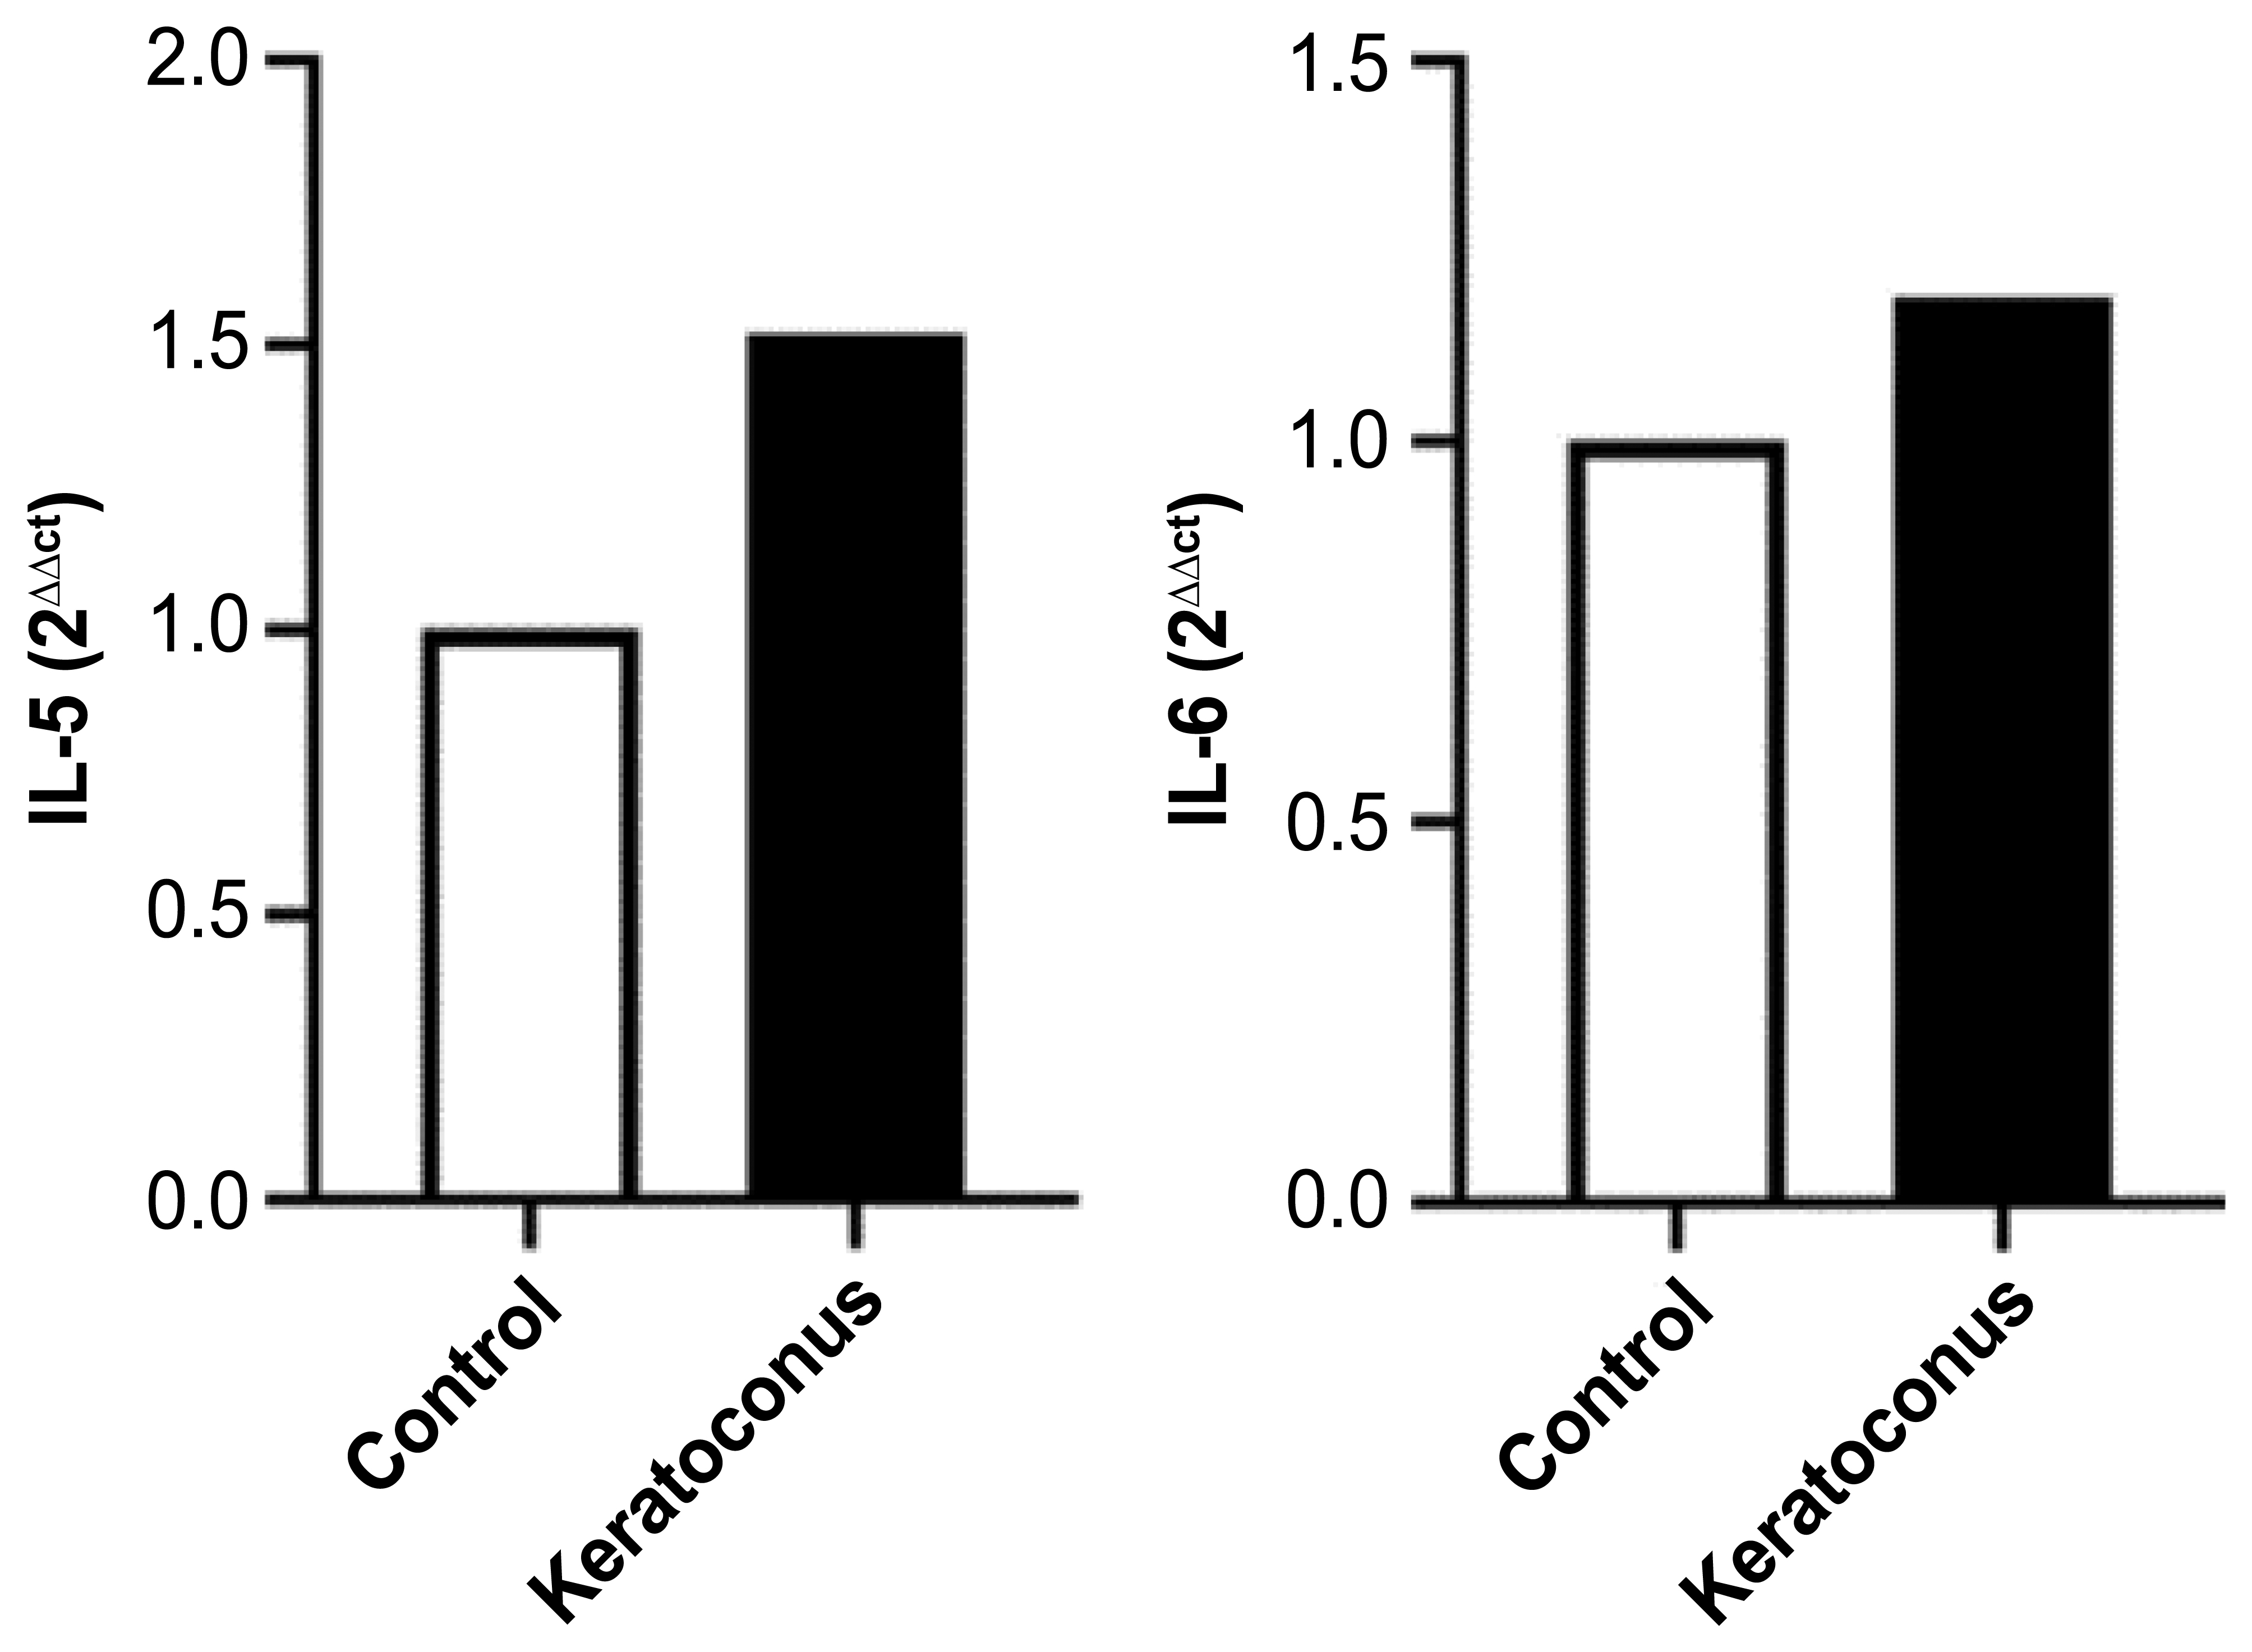
Figure 1.
Bar graph demonstrating
IL-5
and
IL-6
gene expression in corneal epithelial cells from the keratoconus and control groups.
 Figure 1 of
Santos, Mol Vis 2024; 30:279-288. Figure 1 of
Santos, Mol Vis 2024; 30:279-288.
Figure 1 of
Santos, Mol Vis 2024; 30:279-288. Figure 1 of
Santos, Mol Vis 2024; 30:279-288.